Counting From Orbit Screensaver
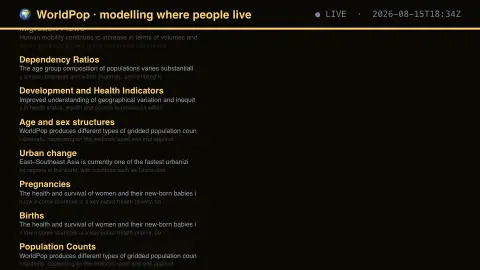
The Counting From Orbit screensaver lists the population datasets WorldPop publishes — counts, densities, births, pregnancies, age and sex structure, migration and development indicators. It runs in the browser with nothing to install; press ESC to exit.
Live preview
Press ESC to leave fullscreen. Settings are saved in your browser only.
How the Counting From Orbit screensaver works
The saver reads WorldPop at the University of Southampton, refreshed through this site's pipeline.
No account and no key: the request goes straight from your browser, or from this site's own refreshed copy of the feed where the source does not permit browser access.
Values are drawn on a canvas that resizes with the window, so it works on a laptop or a wall display.
If the source is unreachable the saver says so on screen rather than showing stale numbers as though they were current.
How WorldPop turns surveys into grids
WorldPop is an interdisciplinary research group based at the University of Southampton. It works to improve population data at local levels, combining information from satellites, surveys, cellphones and other geospatial sources. The aim is to answer what official statistics often cannot: not just how many people live in a district, but where within it. The output is a raster, a grid of small cells each holding an estimated number of people.
These numbers are modelled. Censuses are typically published only as counts per administrative unit, and WorldPop’s top-down methods use detailed geospatial datasets and Random Forests machine learning to disaggregate those counts to grid cells. Where the census is old or incomplete, the estimate is only as good as that input. Two approaches are used: unconstrained models estimate population for all land grid cells, while constrained models place people only in cells mapped as containing built settlements, using building footprints and settlement maps.
The screensaver lists the types of dataset the project publishes, such as counts, densities, births or age structures. It describes the catalogue, not the population values themselves, which are large files meant for use in GIS and analysis.
A worked example
Each entry names a dataset and describes what it models. WorldPop estimates where people live at hundred-metre resolution by combining census returns with satellite imagery, which matters most precisely where the census is weakest — and where the modelling is also hardest to check.
Settings & tips
- Accent and Background recolour the display without changing the data.
- Add it to a Multi-view grid to watch it alongside other live savers.
- Press ESC at any time to leave fullscreen.
Frequently asked questions
- Are these counts or estimates?
- Estimates. They are modelled from census data, satellite imagery and other covariates. Their value lies in places where a reliable count does not exist, which is also where they are least verifiable.
- Who uses this data?
- Humanitarian agencies planning responses, epidemiologists estimating exposure, and infrastructure planners — anyone who needs population figures at a finer grain than administrative boundaries provide.
- Is this real data?
- Yes. It comes from WorldPop at the University of Southampton, refreshed through this site's pipeline. Nothing is invented or simulated, and if the source cannot be reached the saver reports that instead of drawing something plausible.
- Does it cost anything or need an account?
- No. Every screensaver here is free, runs in the browser and needs no sign-up. This one uses a public API that requires no key.
- What is a gridded population dataset?
- It divides a map into small cells and gives each cell an estimated population. WorldPop’s global age and sex structured datasets, for example, use 100 by 100 metre cells. This lets analysts combine population with other maps, such as flood zones or clinics.
- Why model population instead of counting it?
- Censuses are typically carried out only about once every ten years and are published as counts per administrative unit, which hides variation within each unit. Modelling uses other geospatial data to estimate how people are spread within an area.
- What is the difference between constrained and unconstrained datasets?
- Unconstrained estimates predict population for every land grid cell, which can put people in uninhabited areas. Constrained estimates allocate people only to cells mapped as built settlement, which depends on how accurate the satellite settlement mapping is.