Wind Farm Output Screensaver
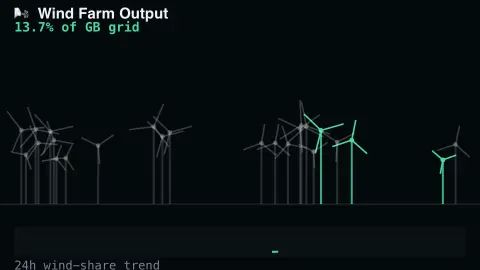
The Wind Farm Output screensaver animates a field of wind turbines whose blade speed and lit count scale to Great Britain's real live wind-generation output, alongside a 24-hour trend line — key-less, live from the National Grid Carbon Intensity API. It's free, runs in your browser, and ESC exits.
Live preview
Press ESC to leave fullscreen. Settings are saved in your browser only.
How the Wind Farm Output screensaver works
The saver fetches Great Britain's real live share of electricity coming from wind.
Turbine blades spin faster, and more turbines light up, as real wind output rises.
A trend line along the bottom tracks the last 24 hours of real wind generation.
Data refreshes on a schedule to track real grid conditions.
How much of Britain's power is blowing in the wind
Great Britain's Carbon Intensity API was developed by the National Energy System Operator (NESO) in partnership with Environmental Defense Fund Europe, the University of Oxford's Department of Computer Science and WWF. It works in half-hour settlement periods, and its generation mix lists the fuels gas, coal, nuclear, biomass, hydro, imports, solar, wind and other.
The figure on screen is therefore a share of generation, not a count of turbines turning. A calm night with low demand can still give wind a modest percentage, while a gale during peak hours can push it much higher. Wind output varies a great deal between hours, days and seasons, which is why the 24-hour trend line is a better guide than any single reading.
Wind appears in the mix as one combined category, so onshore and offshore farms are not separated. Because the service describes its data as a mix of forecast and estimated values, treat it as a good picture of the national balance rather than an exact tally. The animated blades are an illustration of that share, not a model of a particular farm.
A worked example
On a blustery day the whole field spins briskly and every turbine lights — real wind output is running high — while a calm day leaves most turbines dim and idle.
Settings & tips
- Turbine count sets how many turbines fill the field.
- Accent recolours the turbine lights.
- Blade speed is relative to the day's own range, not an absolute physical speed.
Frequently asked questions
- Whose grid is this?
- Great Britain's — the National Grid Carbon Intensity API, a free, key-less, official real-time source.
- Is a key needed?
- No. The API is free and key-less.
- Does turbine count change the data?
- No — it's purely a display choice; the underlying wind-output data is the same.
- Is it free?
- Yes — free, no download, in your browser.
- Does it show offshore and onshore wind separately?
- No. The generation mix reports a single wind category, so the display cannot tell you where the turbines are located.
- Which other fuels are in the mix?
- The Carbon Intensity API lists gas, coal, nuclear, biomass, hydro, imports, solar, wind and other, with wind shown as one share among them.
- How often does the underlying data update?
- The service works in half-hour settlement periods (48 a day), so the underlying numbers change in steps rather than continuously.