Ozone Hole Watch Screensaver
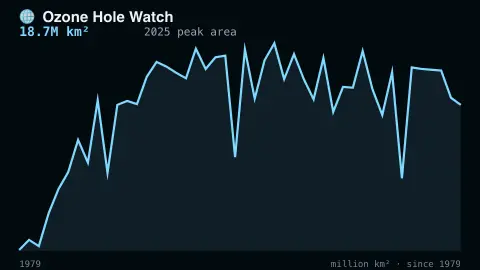
The Ozone Hole Watch screensaver shows the real Antarctic ozone hole's peak size and minimum ozone level, tracked year by year from NASA's own published satellite data. It is free, runs in your browser, and ESC exits.
Live preview
Press ESC to leave fullscreen. Settings are saved in your browser only.
How the Ozone Hole Watch screensaver works
The saver reads NASA's own real published annual record of the Antarctic ozone hole's peak area and minimum ozone level.
A real historical trend line plots the hole's size across every year since satellite monitoring began in 1979.
The pipeline refreshes the record on the source's own real annual schedule.
No key is required for the published NASA data.
How the Antarctic ozone hole is measured
Ozone is a form of oxygen with three atoms to the molecule, and most of it sits in a layer of the stratosphere that absorbs much of the Sun's harmful ultraviolet radiation. NASA's Ozone Watch pages collect the yearly record of the Antarctic ozone hole, built from satellite instruments that monitor the ozone layer and produce maps of total column ozone.
Two numbers describe each year. The area is the region enclosed by a line of constant 220 Dobson units on a map of total column ozone, usually given in millions of square kilometres. The minimum is the lowest total ozone value measured over the Antarctic region, also in Dobson units. One Dobson unit is 0.001 atm-cm: bring all the ozone in a column of air to 0 degrees C and standard pressure and 100 units would form a layer 1 millimetre thick.
NASA explains the 220-unit threshold this way: values below 220 were not found in historical observations over Antarctica before 1979, and column ozone below that level results from ozone loss caused by chlorine and bromine compounds. The 1987 Montreal Protocol set controls on the production of those ozone-depleting substances.
A worked example
The real, well-documented shrinking trend in peak ozone hole size since the 2000s, following the Montreal Protocol, is visible directly in the historical line.
Settings & tips
- Accent recolours the trend line.
- Figures are real satellite measurements, not modeled projections.
- The record updates once each real Antarctic spring season.
Frequently asked questions
- Is this real satellite data?
- Yes — NASA's own real published Antarctic ozone hole record since 1979.
- Is a key needed?
- No. NASA publishes the record freely.
- Is the ozone hole shrinking?
- The real long-term data shows recovery since the Montreal Protocol phased out ozone-depleting chemicals.
- Is it free?
- Yes — free, no download, in your browser.
- What is a Dobson unit?
- It is the unit for total ozone in a column of air. If all the ozone in the column were brought to 0 degrees C and standard pressure, 100 Dobson units would be a layer 1 millimetre thick.
- Why is 220 Dobson units used as the threshold?
- According to NASA, ozone values below 220 were not found in historical observations over Antarctica before 1979, and values that low result from ozone loss caused by chlorine and bromine compounds.
- What was the Montreal Protocol?
- It is a 1987 international agreement that set controls on the production of ozone-depleting substances such as chlorofluorocarbons.