Global Renewable Capacity Growth Screensaver
The Global Renewable Capacity Growth screensaver ranks countries by real installed renewable energy capacity. It is free, runs in your browser, and ESC exits.
Live preview
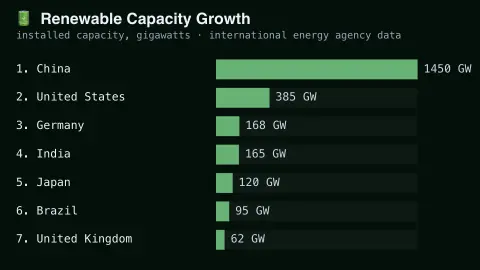
Press ESC to leave fullscreen. Settings are saved in your browser only.
How the Global Renewable Capacity Growth screensaver works
The saver displays a real, curated ranking of countries by their published installed renewable energy capacity.
Each country shows its real reported capacity, in gigawatts.
The board refreshes periodically as new real energy agency statistics are published.
No live feed is required — figures are a real, curated periodic snapshot.
Capacity versus output in renewable power
Installed renewable capacity is the maximum power, measured in gigawatts, that a country's renewable plants could generate. IRENA, the International Renewable Energy Agency, publishes annual Renewable Capacity Statistics by country and technology, including solar, wind, hydropower, bioenergy and geothermal. It counts capacity as the maximum net generating capacity of plants that produce electricity from renewables, usually as of the end of the calendar year. One gigawatt is a billion watts.
Capacity is not generation. A solar farm produces nothing at night and a wind farm only when the wind blows, so each technology delivers a different share of its theoretical maximum over a year; that share is called the capacity factor. A country with a lot of installed solar can therefore generate less energy than its capacity figure suggests, and capacity is measured in watts while generated energy is measured in watt-hours.
Rankings by total also favour big and populous countries, so a small nation with a high renewable share can sit low. The figure says nothing about electricity demand, how clean the rest of the grid is, or whether capacity is actually running. Agencies can revise past figures, so treat the board as a periodic snapshot.
A worked example
A country with a real, large-scale solar and wind buildout tops the board, exactly matching published international energy agency figures.
Settings & tips
- Accent recolours the ranking bars.
- Figures are real, published international energy agency statistics.
- Capacity reflects installed potential, not real-time generation.
Frequently asked questions
- Is this real energy data?
- Yes — real published installed renewable capacity statistics.
- Is a key needed?
- No — figures are a curated real periodic snapshot.
- Does capacity equal actual output?
- No — capacity is real installed potential; actual generation varies with real weather and demand.
- Is it free?
- Yes — free, no download, in your browser.
- What is a gigawatt?
- A billion watts of power. It is a unit of capacity, not of the energy generated over time, which is measured in gigawatt-hours.
- Why can capacity growth outpace generation growth?
- Capacity is the maximum a plant can deliver, while generation depends on how much it actually runs. Solar and wind output depends on weather.
- Does a larger capacity mean greener electricity?
- Not on its own. The share of demand met by renewables depends on total consumption and the other sources on the grid.