End To End Screensaver
The End To End screensaver shows the current temperature at every station in Sweden's national observation network, with the warmest and coldest listed side by side and the spread between them named. It runs in the browser with nothing to install; press ESC to exit.
Live preview
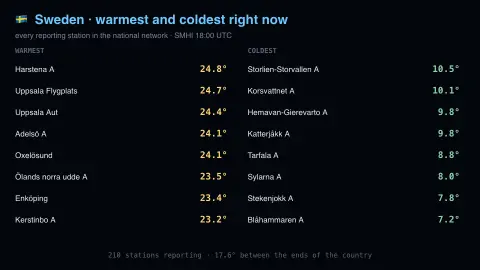
Press ESC to leave fullscreen. Settings are saved in your browser only.
How the End To End screensaver works
The saver reads SMHI, the Swedish meteorological and hydrological institute, key-free.
No account and no key: the request goes straight from your browser, or from this site's own refreshed copy of the feed where the source does not permit browser access.
Values are drawn on a canvas that resizes with the window, so it works on a laptop or a wall display.
If the source is unreachable the saver says so on screen rather than showing stale numbers as though they were current.
Sweden's long thermometer
Sweden is about 1,574 kilometres long from south to north, and roughly 15 percent of the country lies north of the Arctic Circle, which crosses Norrbotten County. That length, plus the mountain range along the Norwegian border, gives a wide span of temperatures at any given hour. SMHI, the Swedish Meteorological and Hydrological Institute, is a government agency that works in meteorology, hydrology, oceanography and climatology, and it publishes open data from its observation network.
SMHI's open-data air temperature series is an instantaneous value in degrees Celsius, reported once an hour from each active station. The latest-hour file covers every active station in a single file. Archived data on SMHI's download service has passed quality control, but the most recent months are held back while they are still being reviewed, so the figure on the board is the latest reported value, not a verified climate record.
Because the stations sit at different elevations and distances from the coast, raw readings are not adjusted to a common altitude. A mountain station will usually read colder than a coastal one. Sweden's span of latitude means the spread between the warmest and coldest station is typically widest in winter, when days in the north are very short, and narrower in summer.
A worked example
Two columns: warmest on the left, coldest on the right, each station named and coloured by temperature. Sweden is 1,600 kilometres long, so on a winter night the gap between the ends of the list can exceed thirty degrees. Stations that filed no reading this hour are dropped rather than drawn as zero, because a missing instrument is not a cold one.
Settings & tips
- Accent and Background recolour the display without changing the data.
- Add it to a Multi-view grid to watch it alongside other live savers.
- Press ESC at any time to leave fullscreen.
Frequently asked questions
- How many stations report?
- Between two and three hundred in any given hour, out of a larger network. Not every station reports every parameter every hour, and the count of those that did is shown at the bottom.
- Why is the spread so large?
- Because Sweden spans from the temperate south to well inside the Arctic Circle. In winter the north can sit under a deep inversion at minus thirty while the south stays near freezing under maritime air.
- Is this real data?
- Yes. It comes from SMHI, the Swedish meteorological and hydrological institute, key-free. Nothing is invented or simulated, and if the source cannot be reached the saver reports that instead of drawing something plausible.
- Does it cost anything or need an account?
- No. Every screensaver here is free, runs in the browser and needs no sign-up. This one uses a public API that requires no key.
- Why is the south so much warmer than the north in winter?
- Latitude sets how much sunlight reaches the surface, and the far north gets very little in winter. The southern coast is also moderated by the sea, which holds heat longer than land.
- What does SMHI do besides weather?
- SMHI is a Swedish government agency that also works in hydrology, oceanography and climatology, and issues warnings for severe weather and water events.
- Are the readings corrected for altitude?
- No. Station temperatures are shown as reported, so a mountain station will usually read colder than a coastal one.