Solar Flare Monitor Screensaver
The Solar Flare Monitor screensaver is a live oscilloscope of the Sun's X-ray flux from NOAA's GOES satellites, sweeping across the A-B-C-M-X flare scale so you can watch solar flares erupt in real time. It's free, key-less, runs in your browser, and ESC exits.
Live preview
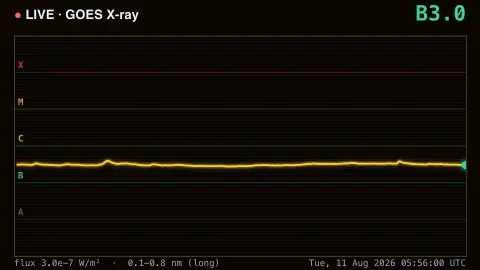
Press ESC to leave fullscreen. Settings are saved in your browser only.
How the Solar Flare Monitor screensaver works
The saver streams the GOES X-ray flux feed from NOAA's Space Weather Prediction Center — the same data used to classify solar flares — with no key.
It plots the last six hours of flux as a glowing strip-chart on a logarithmic scale, the way flare monitors are drawn.
Horizontal band lines mark the flare classes A, B, C, M and X, each a tenfold jump in intensity.
The current level is read out as a flare class like C2.3 and colored by severity, updating every minute as the Sun rises and falls.
How GOES measures solar flares
The GOES satellites carry X-ray sensors that watch the whole Sun, and NOAA's Space Weather Prediction Center publishes the resulting flux. Flares are classed by their peak soft X-ray flux in the 0.1 to 0.8 nanometre band (1 to 8 angstroms). The letters A, B, C, M and X each step up by a factor of ten: B starts at 10⁻⁷ watts per square metre, C at 10⁻⁶, M at 10⁻⁵ and X at 10⁻⁴. The number after the letter is the multiplier within the class, so C2.3 is 2.3 × 10⁻⁶.
The X class is open-ended, so the numbers can pass 9; NOAA's radio blackout scale reaches X10 for its fourth level and X20 for its fifth. Flare class describes brightness in X-rays, not the full space weather impact. Because X-rays travel at the speed of light, radio blackouts on the sunlit side of the Earth occur as the event is observed, and flares themselves last from minutes to hours.
Geomagnetic storms are a separate phenomenon, rated on their own scale, so a bright flare does not by itself say what will happen to Earth's magnetic field. Read the trace as a monitoring view of X-ray output, and remember that the flux rises and falls with the roughly eleven-year solar cycle, so a quiet stretch can sit near the lower classes for a long time.
A worked example
For most of the day the trace idles in the B and C range, then a flare erupts and the line leaps toward M or even X — the same spikes that can spark auroras and radio blackouts, drawn live as the Sun produces them.
Settings & tips
- Logarithmic scale spreads the flare classes evenly (recommended); turn it off for a linear view.
- Trace color recolours the flux line.
- Background sets the scope backdrop.
Frequently asked questions
- Is the flux live?
- Yes. It streams from NOAA's GOES X-ray sensors and updates every minute, so you see flares as they happen.
- What do A, B, C, M and X mean?
- They're the solar flare classes, each ten times stronger than the last. C is minor, M is medium, and X-class flares are the most powerful.
- Does it need a key?
- No. NOAA's space-weather feeds are free and key-less; the saver only needs an internet connection.
- How does this relate to Space Weather?
- Space Weather shows the resulting aurora and Kp index; this monitor shows the X-ray flares at the source on the Sun.
- Is it free?
- Yes — free, no download, in your browser.
- Does a big flare mean a geomagnetic storm?
- Not on its own. A flare's immediate effect is radio blackouts on the sunlit side of Earth, which NOAA rates on a radio blackout scale. Geomagnetic storms are rated separately and are not set by flare class alone.
- Why is the chart logarithmic?
- Flux spans several orders of magnitude between quiet conditions and a major flare. A logarithmic axis lets both be read on one chart, and each class is a tenfold step.