Port Congestion Watch Screensaver
The Port Congestion Watch screensaver rotates through a real, curated record of notable global container-port congestion events. It is free, runs in your browser, and ESC exits.
Live preview
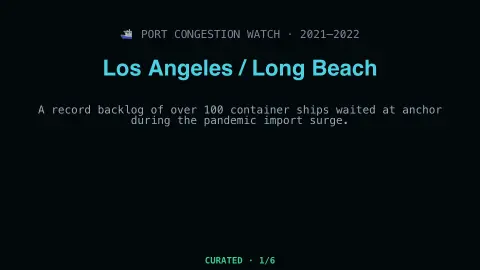
Press ESC to leave fullscreen. Settings are saved in your browser only.
How the Port Congestion Watch screensaver works
The saver displays a real, curated record of notable recent container-port congestion events, drawn from public shipping-industry reporting.
Each entry shows the real port or region, real approximate scale, and a short real description.
Entries rotate through the record on a timer.
No live feed is required — the record is a real, curated periodic snapshot.
What port congestion is and how it is measured
Container ports are the points where cargo switches between ships, trains and trucks. Congestion happens when ships arrive faster than a port can load, unload and clear them, so vessels wait at anchor for a berth and containers sit longer in the yard. Causes include surges in demand, labour disputes, severe weather, equipment shortages and shortages of trucks or rail capacity to take cargo inland.
Analysts track it in several ways: the number of ships queued outside a port, the average waiting time to berth, and the time containers dwell in a terminal. Satellite-based vessel tracking, called AIS (Automatic Identification System), is often used to count ships at anchor. Reports from shipping lines, port authorities and trade press then describe the size and the reason for each episode.
The display is a curated record of past events, not a live vessel tracker, so it describes episodes in general terms and not current conditions at any port. Congestion at one place spills outward: delayed ships miss their next calls, schedules shift and costs can rise for importers elsewhere. That is why a disruption at one port can be felt in delivery times far away, sometimes weeks later.
A worked example
A real record-setting vessel backlog off a major port appears in rotation with its real approximate scale and cause, as publicly reported at the time.
Settings & tips
- Accent recolours the event cards.
- Entries reflect real, publicly reported shipping-industry events.
- The record updates periodically as notable new events occur.
Frequently asked questions
- Is this real shipping data?
- Yes — real, publicly reported port congestion events from shipping-industry sources.
- Is a key needed?
- No — the record is a curated real periodic snapshot.
- Is this a live vessel tracker?
- No — it is a curated historical record of notable events, not real-time vessel positions.
- Is it free?
- Yes — free, no download, in your browser.
- What causes ships to queue outside a port?
- Arrivals exceed the port's ability to handle cargo, often from high demand, labour or equipment issues, bad weather, or limited inland transport.
- How is congestion measured?
- Common measures are the number of vessels waiting, the average waiting time for a berth and the time containers stay in the terminal.
- Can congestion affect consumer prices?
- It can contribute. Delays and higher freight costs can pass through to importers and eventually to goods, but other factors affect prices too.