Malaria Incidence Board Screensaver
The Malaria Incidence Board screensaver ranks real estimated malaria incidence per 1,000 population at risk by country. It is free, runs in your browser, and ESC exits.
Live preview
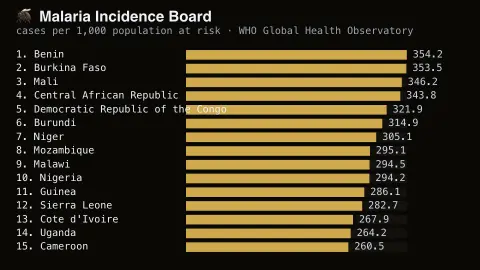
Press ESC to leave fullscreen. Settings are saved in your browser only.
How the Malaria Incidence Board screensaver works
The saver reads real estimated malaria incidence per 1,000 population at risk data from the WHO's own Global Health Observatory API.
Countries are ranked by their real latest reported malaria incidence.
The pipeline refreshes on the WHO's own periodic release schedule.
No key is required for this key-less public endpoint.
How malaria incidence is estimated
Malaria incidence here means the estimated number of new malaria cases per 1,000 population at risk per year. WHO defines the population at risk as people living in areas where malaria transmission occurs, so a country with malaria in only part of its territory is measured against the people exposed there rather than the whole population. The figures are published through WHO’s Global Health Observatory.
The numbers are estimates, not simple counts. In many places confirmed cases are adjusted for the share of people who seek health services, for underreporting, and for the likelihood that suspected cases are actually parasite-positive. Where surveillance is too weak in high-transmission parts of Africa, case numbers are instead estimated from parasite prevalence data. The denominator comes from official UN population estimates, adjusted to the population at risk where endemicity varies within a country.
WHO gives a 95% uncertainty interval around each point estimate, which the saver does not draw. Read the ranking as a comparison of estimated burden among countries, not as a measure of risk to an individual traveller, and remember that an estimate is only as firm as the data and methods behind it.
A worked example
A real country's most recent reported malaria incidence is ranked against the real others, with bars easing into place as the board loads.
Settings & tips
- Incidence is per 1,000 population at risk, the WHO's standard measure.
- Accent recolours the bars and header text.
- Values and years are real, unedited WHO Global Health Observatory data.
Frequently asked questions
- Is this real health data?
- Yes — real estimated malaria incidence per 1,000 population at risk figures from the WHO's own Global Health Observatory API.
- Is a key needed?
- No. The GHO OData API is fully key-less.
- How often does it update?
- The pipeline re-reads the WHO's own dataset periodically, on whatever schedule WHO republishes that indicator.
- Is it free?
- Yes — free, no download, in your browser.
- Why is incidence per population at risk and not per capita?
- Malaria is transmitted only in certain places. WHO divides by the population living in areas where transmission occurs, which gives a fairer comparison than dividing by everyone in the country.
- Are these counted cases or estimates?
- Estimates. They draw on reported cases that are adjusted for people who seek care, for underreporting and for test positivity, and in some high-transmission areas of Africa they are derived from parasite prevalence data.