Tuberculosis Incidence Board Screensaver
The Tuberculosis Incidence Board screensaver ranks real tuberculosis incidence per 100,000 population by country. It is free, runs in your browser, and ESC exits.
Live preview
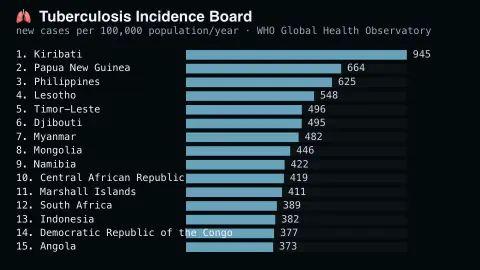
Press ESC to leave fullscreen. Settings are saved in your browser only.
How the Tuberculosis Incidence Board screensaver works
The saver reads real tuberculosis incidence per 100,000 population data from the WHO's own Global Health Observatory API.
Countries are ranked by their real latest reported TB incidence.
The pipeline refreshes on the WHO's own periodic release schedule.
No key is required for this key-less public endpoint.
What incidence of tuberculosis means
Incidence is the number of new tuberculosis cases arising in a population during a year, expressed per 100,000 people. The WHO publishes it for each country as an estimate rather than a count: it draws on case notifications, national disease surveys and, in some countries, dynamic models, because many people with TB are never diagnosed or reported. The figure therefore differs from the number of cases officially notified to health authorities.
For scale, the WHO's Global Tuberculosis Report 2024 estimated that 10.8 million people fell ill with TB worldwide in 2023, equivalent to 134 new cases per 100,000 population, with a 95% uncertainty interval of 125 to 145. Every national estimate carries an uncertainty range of its own, which this display does not show. About 6.1% of incident cases globally were among people living with HIV, and they are included in the totals.
A rate describes how common new disease is, not how well a health system performs: surveillance quality, detection and treatment coverage all affect both the estimate and the real burden. Countries with small populations can show volatile rates because a few cases make a large difference. Year-to-year changes can reflect revised methods as well as real trends. This display is informational and is not a source of medical or public-health guidance.
A worked example
A real country's most recent reported TB incidence is ranked against the real others, with bars easing into place as the board loads.
Settings & tips
- Incidence is new cases per 100,000 population per year.
- Accent recolours the bars and header text.
- Values and years are real, unedited WHO Global Health Observatory data.
Frequently asked questions
- Is this real health data?
- Yes — real tuberculosis incidence per 100,000 population figures from the WHO's own Global Health Observatory API.
- Is a key needed?
- No. The GHO OData API is fully key-less.
- How often does it update?
- The pipeline re-reads the WHO's own dataset periodically, on whatever schedule WHO republishes that indicator.
- Is it free?
- Yes — free, no download, in your browser.
- Why is this an estimate and not a count?
- Many cases go undiagnosed or unreported, so the WHO combines notifications, surveys and modelling to estimate the true number of new cases.
- What does per 100,000 per year mean?
- It means the number of new cases in one year for every 100,000 people, which lets countries of different sizes be compared on a common scale.