Global Food Price Index Screensaver
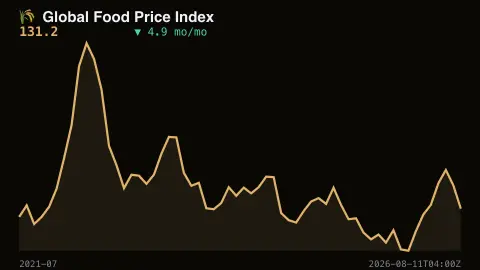
The Global Food Price Index screensaver charts the United Nations FAO's real Food Price Index — the world's benchmark measure of monthly change in international food commodity prices — refreshed by a background pipeline. It's free, runs in your browser, and ESC exits.
Live preview
Press ESC to leave fullscreen. Settings are saved in your browser only.
How the Global Food Price Index screensaver works
A background pipeline reads the FAO's real published monthly Food Price Index series.
A chart plots the index over recent years, tracking real global food cost pressure.
The current index value and its change from the prior month are shown alongside the chart.
Figures refresh on the pipeline's schedule, matching the FAO's own real monthly publication.
What the FAO index actually tracks
The Food Price Index is published by the Food and Agriculture Organization of the United Nations, and it tracks monthly changes in the international prices of a basket of food commodities. It is the average of five commodity group price indices, covering cereals, vegetable oils, dairy, meat and sugar, weighted by the average export shares of each group over 2014-2016.
The numbers are index values, not dollars, and the monthly change shows direction and speed. The index follows prices on international markets, so it does not capture what a shopper pays in a particular country, where currency, transport, taxes and retail margins all intervene.
The series is published once a month, so it is a slow-moving chart by design. Earlier values can be revised: the FAO notes that the meat index is partly based on projected prices because most meat prices are not yet available at first publication, and that can change the headline figure later. The FAO provides both nominal and real series, and it is a measure of commodity markets rather than a forecast of hunger or supply.
A worked example
The chart's spikes align with real events — droughts, conflicts, supply shocks — that pushed global food prices up, straight from the FAO's own published series.
Settings & tips
- Accent recolours the chart line.
- Run
automation/run.py foodpriceindexon your pipeline machine to refresh the data. - The index tracks cereals, vegetable oils, dairy, meat and sugar together as a weighted basket.
Frequently asked questions
- Is the data real?
- Yes — it comes directly from the UN Food and Agriculture Organization's own published index.
- Why does it need a pipeline?
- The FAO's index isn't reliably fetchable directly from a browser, so a small background script gathers it and saves a snapshot the saver loads — no key needed, just a server-side fetch.
- How often does it update?
- Monthly, matching the FAO's own real publication schedule.
- Is it free?
- Yes — free, no download, in your browser.
- What are the five parts of the index?
- Cereals, vegetable oils, dairy, meat and sugar. They are combined using weights based on each group's average export share over 2014-2016.
- Does a rising index mean grocery bills are rising everywhere?
- Not directly. It tracks international commodity prices, and local retail prices also depend on exchange rates, transport costs, taxes and processing.
- Is the index adjusted for inflation?
- The FAO publishes both nominal and real series. Be careful when comparing years with different general price levels, and check which series you are reading.