Where the Federal Money Goes Screensaver
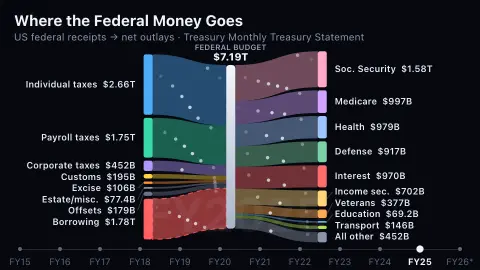
Where the Federal Money Goes is a Sankey-diagram screensaver of the US federal budget: receipts by source and borrowing flow in from the left, net outlays by function flow out to the right, through one central bar, stepping through fiscal years from FY2015. It uses US Treasury Monthly Treasury Statement data, is free and key-less, and ESC exits.
Live preview
Press ESC to leave fullscreen. Settings are saved in your browser only.
How the Where the Federal Money Goes screensaver works
The site's data pipeline reads Table 9 of the Treasury's Monthly Treasury Statement — the one table that lists receipts by source and outlays by function together — takes each fiscal year's figure from the September statement, and checks that the lines add up to the statement's own totals before saving anything.
Everything flows through a single central bar, on purpose. Treasury does not earmark general revenue, so an income-tax dollar is not spent on any one program, and routing every source into one pool shows the totals in and out without inventing a link between them.
A flow cannot be negative, but a few outlay lines are: undistributed offsetting receipts and, in most years, commerce and housing credit. They are drawn as an "offsetting receipts" source on the left, so sources and uses balance exactly. Borrowing is drawn in red, as a source, because that is what it is.
The ribbons are resized year to year with the labels counting up and down, and a strip of chips underneath states what stands out in the year on screen: how much was borrowed, what interest cost, and the Social Security and Medicare share. The latest year is a part year if the September statement is not out, and is labelled with how many months it covers.
Reading the Monthly Treasury Statement as a flow
The Monthly Treasury Statement is prepared by the Bureau of the Fiscal Service, part of the US Department of the Treasury. It reports the money flowing into and out of the Treasury: receipts by tax type or other source, outlays by department and agency or function, and how any deficit is financed, such as by borrowing from the public. The US federal fiscal year ends on 30 September, and the September statement closes out the year.
A Sankey diagram is a good fit for this because its ribbon widths are proportional to the amount flowing. Sources of money are on one side, uses are on the other, and the widest ribbons are the biggest items. Outlays are grouped by function, a classification by purpose such as national defense, health, income security or net interest, rather than by agency, so a single department's budget can be split across several ribbons.
A few cautions help in reading it. Figures are nominal dollars, so they are not adjusted for inflation or population, and growth over time reflects both. Net outlays are after offsetting receipts, which are collections credited against spending. The display is one view of federal finances, and it is separate from the national debt, which is the accumulated total of past borrowing. It also leaves out state and local government spending.
A worked example
In FY2025 the government took in $5.23 trillion and spent $7.01 trillion, so $1.78 trillion — 25% of spending — was borrowed. Interest on the debt cost $970 billion, more than the $917 billion spent on defense; in FY2015 interest was $223 billion. In FY2020 the deficit was $3.13 trillion, 48% of that year's spending.
Settings & tips
- Fiscal year holds one year still instead of stepping through them; the part-year option shows the current year so far.
- Speed sets how long each year stays on screen.
- Press ESC to leave fullscreen.
Frequently asked questions
- Why does everything pass through one central bar?
- Because the data does not say which tax pays for which program. General revenue is pooled, and drawing a ribbon from, say, corporate tax to defense would claim a link the Treasury does not make. The central bar shows what came in and what went out, and nothing more.
- What is the "offsetting receipts" source?
- A flow cannot be negative, and some outlay lines are — mainly the Treasury's undistributed offsetting receipts, such as employer retirement contributions and royalties, which it subtracts from spending. They are moved to the left as a small source so the two sides still balance.
- Is the deficit the same as the debt?
- No. The deficit is one year's gap between spending and receipts — the red "borrowing" ribbon. The debt is the accumulated total of all those gaps, and the interest on it is the "interest on the debt" ribbon on the right.
- Why does the latest year look smaller?
- If the Treasury has not yet published the September statement, the latest year covers only some months and is marked with an asterisk and its month count. It is not a full year and should not be compared with one.
- Where does the data come from?
- The US Treasury's Monthly Treasury Statement, Table 9, through its open Fiscal Data API. Fiscal years run from October to September.
- What is the difference between receipts and outlays?
- Receipts are money flowing into the Treasury, mostly taxes, while outlays are money flowing out. When outlays exceed receipts the result is a deficit, which is financed by borrowing; when receipts exceed outlays it is a surplus.
- Are the amounts adjusted for inflation?
- No. They are shown in the dollars of each year, so a larger ribbon in a later year can partly reflect higher prices and a bigger economy rather than a real-terms increase.
- Why do the figures differ from other budget sources?
- Publishers can use different definitions, such as on-budget versus off-budget items, net versus gross outlays, or fiscal versus calendar years, and projections are estimates rather than reported results. Totals can therefore differ between this statement and other sources.