Dutch Air Quality Screensaver
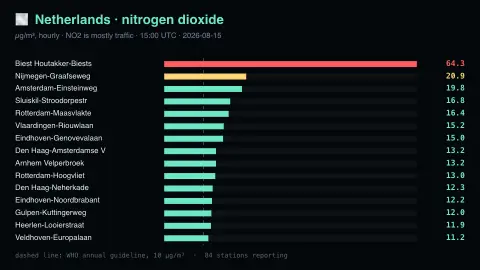
The Dutch Air Quality screensaver ranks live nitrogen dioxide readings across the Netherlands' national monitoring network, in micrograms per cubic metre, from Luchtmeetnet. NO2 is overwhelmingly a traffic pollutant, so roadside stations in the big cities sit far above the rural background, and a dashed line marks the WHO annual guideline of 10 µg/m³. It runs in the browser with nothing to install; press ESC to exit.
Live preview
Press ESC to leave fullscreen. Settings are saved in your browser only.
How the Dutch Air Quality screensaver works
The saver reads Luchtmeetnet, the open air quality API run by the Dutch national institute RIVM.
No account and no key: the request goes straight from your browser, or from this site's own refreshed copy of the feed where the source does not allow browser access.
Values are drawn on a canvas that resizes with the window, so it works on a laptop or a wall display.
If the source is unreachable the saver says so on screen rather than showing stale numbers as though they were current.
Luchtmeetnet and how NO2 is monitored
Luchtmeetnet is the Dutch air quality service, with RIVM, the National Institute for Public Health and the Environment, managing the national measuring network in cooperation with regional partners such as DCMR and GGD Amsterdam. Around 80 stations across the Netherlands measure various substances, in cities, beside roads and in the countryside, and the data are published openly at luchtmeetnet.nl. Because stations sit in different settings, two points in the same city can read quite differently.
Nitrogen dioxide forms when combustion in engines, boilers and industry produces nitrogen oxides that react further in the air. Roadside concentrations rise with traffic and fall away with distance, so a station beside a busy road reads far higher than one in the countryside. The European Union sets limit values for NO₂, and the World Health Organization recommends lower guideline levels, including an annual guideline of 10 µg/m³.
Hourly readings fluctuate with the weather, the time of day and wind direction, and a single hour says little about annual exposure, which is what limits are mainly designed around. Provisional values may be corrected after validation. Rankings reflect where monitors happen to be placed, not a full map of the country.
A worked example
Fifteen stations are listed by name with a coloured bar each — green under 10 µg/m³, through amber, to red above 40. The dashed line sits at the WHO guideline. Roadside stations in Amsterdam, Rotterdam and Utrecht cluster at the top on a weekday morning; the same stations fall back toward the rural stations on a Sunday, because the difference between them is traffic.
Settings & tips
- Accent and Background recolour the display without changing the data.
- Add it to a Multi-view grid to watch it alongside other live savers.
- Press ESC at any time to leave fullscreen.
Frequently asked questions
- Why nitrogen dioxide rather than particulates?
- Because NO2 is the clearest signal of local traffic. Particulate matter drifts across borders and is heavily influenced by weather, so a high reading may have originated hundreds of kilometres away; NO2 is largely produced where it is measured.
- Why are station names streets rather than cities?
- Because the measurements API returns an opaque station number, and this saver joins it against the published station list to show where the instrument physically stands. Several stations sit within one city and can read very differently.
- Is this real data?
- Yes. It comes from Luchtmeetnet, the open air quality API run by the Dutch national institute RIVM. Nothing is invented or simulated, and if the source cannot be reached the saver reports that instead of drawing something plausible.
- Does it cost anything or need an account?
- No. Every screensaver here is free, runs in the browser and needs no sign-up. This one uses a public API that requires no key.
- What is the difference between a street and a background station?
- A street station sits close to traffic and captures local peaks, while a background or rural station represents general levels away from direct sources.
- Do hourly readings show if limits are exceeded?
- Not directly. Limits and the WHO guideline are mostly defined over longer periods, such as an annual mean, so one hour above or below does not settle compliance.
- Why do readings change with the weather?
- Wind and mixing disperse pollution, while calm, stable air lets it build up, so the same traffic can produce different readings on different days.