Distance From The Peak Screensaver
The Distance From The Peak screensaver ranks major cryptocurrencies by how far they sit below their own all-time high. CoinPaprika publishes that figure directly, so it is not a derived guess: it is the drawdown from the highest price the asset ever traded at, however long ago that was. It runs in the browser with nothing to install; press ESC to exit.
Live preview
Press ESC to leave fullscreen. Settings are saved in your browser only.
How the Distance From The Peak screensaver works
The saver reads The CoinPaprika public ticker API, key-free.
No account and no key: the request goes straight from your browser, or from this site's own refreshed copy of the feed where the source does not allow browser access.
Values are drawn on a canvas that resizes with the window, so it works on a laptop or a wall display.
If the source is unreachable the saver says so on screen rather than showing stale numbers as though they were current.
Reading a drawdown from all-time high
CoinPaprika provides a cryptocurrency market-data API covering prices, volume, market capitalisation and historical data, with a free tier that needs no signup. Its ticker data includes an all-time-high price and date and the percentage gap between the current price and that high. That gap is what finance people call a drawdown from the peak, and the same arithmetic is used for stock indices and funds to judge how far an investment has fallen.
Drawdown arithmetic is asymmetric. An asset that is down 50 per cent from its high needs to double, a 100 per cent gain, to return to it, and one down 90 per cent needs a tenfold rise. Many digital assets are young and volatile, so deep drawdowns can be common, and a record high can sometimes reflect a brief spike rather than a level the market held.
Providers use different exchanges and methods, so recorded peaks and dates can differ between data sources. A ranking by distance from the peak is a description of past prices, and says nothing about what comes next.
A worked example
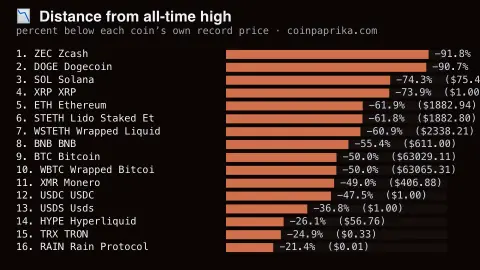
Sixteen bars sorted by depth of drawdown, each labelled with the ticker, the percentage below its record and the current dollar price. Stablecoins are filtered out because their peg makes the number meaningless. A coin at -95% still has holders who bought at the far end of that bar.
Settings & tips
- Accent and Background recolour the display without changing the data.
- Add it to a Multi-view grid to watch it alongside other live savers.
- Press ESC at any time to leave fullscreen.
Frequently asked questions
- Is a big drawdown a buying signal?
- No, and this saver makes no such claim. An asset can stay far below its peak permanently, or fall further. The chart is a record of what people once paid, not a forecast of what they will pay.
- Why exclude stablecoins?
- Because a stablecoin is designed to track a peg. Its distance from an all-time high is a rounding artefact rather than information about the market.
- Is this real data?
- Yes. It comes from The CoinPaprika public ticker API, key-free. Nothing is invented or simulated, and if the source cannot be reached the saver reports that instead of drawing something plausible.
- Does it cost anything or need an account?
- No. Every screensaver here is free, runs in the browser and needs no sign-up. This one uses a public API that requires no key.
- How is the distance from the peak calculated?
- It compares the current price with the highest recorded price and expresses the gap as a percentage. A coin at its record would show zero.
- Why would two sites show different all-time highs?
- Providers use different exchanges and methods, so the recorded peak and its date can differ between them.
- Why does a 50 per cent fall need a 100 per cent gain?
- Because the gain is measured from the lower price. Falling from 100 to 50 and then rising back to 100 means doubling the 50.