Bitcoin Rainbow Chart Screensaver
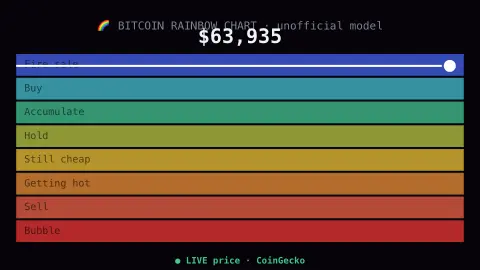
The Bitcoin Rainbow Chart screensaver plots Bitcoin's real live price against the well-known logarithmic rainbow chart valuation bands, computed from the model's own published formula. It's a popular but unofficial model, clearly labeled as such. It's free, runs in your browser, and ESC exits.
Live preview
Press ESC to leave fullscreen. Settings are saved in your browser only.
How the Bitcoin Rainbow Chart screensaver works
The rainbow bands are computed from the model's real published logarithmic-regression formula, based on Bitcoin's real genesis date.
The saver fetches Bitcoin's real live price from CoinGecko, with no key required.
A marker plots exactly where today's real price sits within the band structure.
The price marker updates live as the real market moves.
A curve fit dressed up as a rainbow
The rainbow chart grew out of two separate 2014 posts, as reported by secondary sources. A Bitcointalk user called Trolololo posted a logarithmic regression of Bitcoin's long-run price in October 2014, and a Reddit user called azop had earlier shown coloured bands marking over- and undervaluation. Accounts differ on who later combined them into the live chart, so treat the origin story as loosely documented. Labels such as fire sale or maximum bubble territory are tongue-in-cheek, and the chart has no official standing.
Under the colours is a logarithmic regression: a curve fitted to Bitcoin's price on a log scale against time since its launch, with bands above and below. A log scale keeps the early cents-to-dollars growth and the later thousands-of-dollars growth on one readable chart. Several versions with different parameters and band widths circulate, so two charts called the rainbow chart will not necessarily agree.
The main caveat is that any curve fitted to past data guarantees nothing about the future. Versions have been revised, reportedly after the price fell below the lowest band in 2022. Treat the chart as an amusing way to see where the market sits against its own history, not as a signal. Nothing here is advice.
A worked example
If the real price sits in a lower band, the chart reads as "undervalued" by this particular model's own colour scheme — a popular framework among some traders, not a guarantee of anything.
Settings & tips
- Accent recolours the price marker.
- This is a widely known but unofficial model — treat it as one lens among many, not a forecast.
- The bands are fixed math; only the live price marker moves.
Frequently asked questions
- Is this an official valuation?
- No — the rainbow chart is a popular, unofficial model created by independent analysts, not an official Bitcoin metric.
- Is a key needed?
- No. The live price comes from CoinGecko's free, key-less public API.
- Where do the bands come from?
- A real, published logarithmic regression formula that's been publicly shared and widely used since around 2014.
- Is it free?
- Yes — free, no download, in your browser.
- Why is the chart plotted on a logarithmic scale?
- Bitcoin's price has grown by many orders of magnitude, so a log axis lets early and recent moves be compared on one picture.
- Do different rainbow charts give different bands?
- Yes. Published versions use different formulas and parameters, so the exact position of each colour varies between them.
- Has the model predicted prices correctly?
- It describes past data, and versions have been revised after the price moved outside the bands. It is not evidence of future performance.