Water Stress Board Screensaver
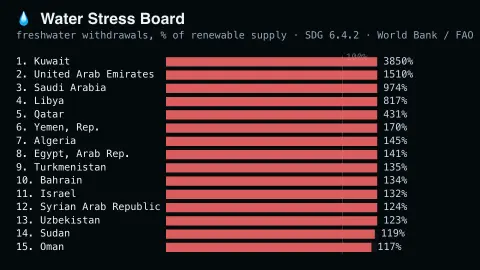
The Water Stress Board screensaver ranks countries by freshwater withdrawals as a percentage of available renewable freshwater — the UN's SDG 6.4.2 water-stress indicator, compiled by FAO AQUASTAT — live from the World Bank's open data API. It's free, needs an internet connection, and ESC exits.
Live preview
Press ESC to leave fullscreen. Settings are saved in your browser only.
How the Water Stress Board screensaver works
The saver calls the World Bank's key-less open data API for the water-stress indicator (ER.H2O.FWST.ZS) with mrnev=1 — 178 countries report, currently with 2022 data.
Rows are colour-coded by severity: the accent colour below 40%, amber for high stress (40–80%), red for critical stress (80% and up).
Values can exceed 100% — desalination and fossil aquifers let countries withdraw more than nature returns — so bars clamp at a 120% mark with a 100% guide line, while the printed numbers stay real.
It refreshes hourly; FAO updates the underlying AQUASTAT series on its own annual cycle.
Measuring pressure on freshwater supplies
The indicator behind this board, SDG 6.4.2, measures how much freshwater all economic activities withdraw relative to the renewable freshwater resources available, expressed as a percentage. The United Nations Sustainable Development Goals list it under target 6.4, which aims to substantially increase water-use efficiency across all sectors and ensure sustainable withdrawals and supply of freshwater. FAO supplies the underlying data through its AQUASTAT database, and the World Bank republishes the series.
The higher the share, the less slack a country has between demand and supply. The official calculation takes environmental flow requirements into account, and values above 100% do occur, which the SDG 6 data portal classes as critical stress. A national figure is still an average, though. A country with a large river in one region and arid land in another can show a comfortable number while parts of it run short, and seasonal shortages vanish into an annual total.
The series depends on national reporting, so countries are covered for different years and some values are several years old. The percentage also says nothing about water quality or whether people can actually get safe water. Use the board for broad comparison, not as a forecast of shortage.
A worked example
Kuwait tops the board near 3,850% — withdrawing dozens of times its renewable freshwater, thanks to desalination — with the UAE, Saudi Arabia and Libya also far past the red 100% line, while the Congo basin sits near zero. It pairs well with the Drought Monitor in Multi-view.
Settings & tips
- Countries shown — how many ranked rows to display (10–25).
- The 100% guide line is the honesty marker: any bar crossing it means withdrawals exceed the country's renewable supply.
- Severity colours follow the standard SDG bands — 40% is 'high stress', 80% is 'critical'.
Frequently asked questions
- Is this real data?
- Yes — the UN's official SDG 6.4.2 water-stress indicator, compiled by FAO AQUASTAT and fetched live from the World Bank's open data API.
- Is a key needed?
- No. The World Bank open data API is public, key-less and CORS-enabled, so the browser calls it directly.
- Does it work offline?
- No. It fetches live from the World Bank, so it needs an internet connection; offline it shows a short notice.
- Is it free?
- Yes — free, no download, in your browser.
- How can water stress be over 100%?
- By withdrawing desalinated seawater and non-renewable 'fossil' groundwater. Kuwait's roughly 3,850% means it uses vastly more freshwater than its renewable sources supply in a year.
- Does a low percentage mean a country has plenty of water?
- Not necessarily. The figure compares withdrawals with available renewable freshwater, so it says little about whether people have reliable access to safe water or how supply varies by region and season.
- Why does the United Nations track this?
- Indicator 6.4.2 sits under target 6.4 of Sustainable Development Goal 6, which covers water-use efficiency and sustainable withdrawals of freshwater, and it measures the level of water stress.