Observed Water Level Screensaver
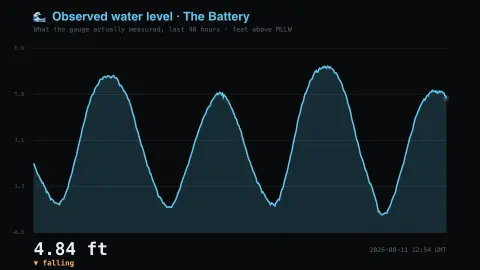
The Observed Water Level screensaver shows what a NOAA tide gauge is really measuring, over 48 hours. Distinct from the site's Tide Clock, which shows the prediction — storms and wind can push the water well away from it. It's free, runs in your browser, and ESC exits.
Live preview
Press ESC to leave fullscreen. Settings are saved in your browser only.
How the Observed Water Level screensaver works
The saver reads NOAA CO-OPS directly in your browser — no key and no account.
What a NOAA tide gauge is really measuring, over 48 hours.
It refreshes on a schedule, so what you see stays current.
Colours can be changed in settings; nothing is stored beyond your own browser.
Observed versus predicted water: why the gauge disagrees with the tables
CO-OPS, NOAA’s Center for Operational Oceanographic Products and Services, operates the US network of coastal water-level stations. Standard gauge data are reported at 6-minute intervals, and the records support navigation products, flood and tsunami warning, and long-term sea-level studies. The screensaver draws the observed record, which is what the water actually did.
Tide predictions are a different product: they are calculated from astronomical cycles, mainly the Moon and Sun, fitted to each station’s history as harmonic constituents. Actual water levels also respond to wind, air pressure and storms, so the observed line can sit above or below the prediction. When a storm pushes water onto a coast, the extra height above the normal tide is called storm surge.
Heights are given relative to a datum, a reference level, so a value of zero is not necessarily sea level in the everyday sense. NOAA offers several datums, including mean lower low water (MLLW), the nautical chart datum for US coastal waters. Near-real-time readings are preliminary: they have not been through NOAA’s quality control, which is applied later, so spikes or gaps can appear.
A worked example
What a NOAA tide gauge is really measuring, over 48 hours. Distinct from the site's Tide Clock, which shows the prediction — storms and wind can push the water well away from it.
Settings & tips
- Accent and Background recolour the display.
- Data comes straight from NOAA CO-OPS in your browser.
- Press ESC to leave fullscreen.
Frequently asked questions
- Is this real data?
- Yes — it comes from NOAA CO-OPS and is refreshed on a schedule.
- How is this different from the Tide Clock?
- The Tide Clock shows the astronomical prediction. This is the water level the gauge actually recorded, which storms, wind and pressure can push well away from prediction.
- Is a key needed?
- No. This source is fully key-less.
- Is it free?
- Yes — free, no download, in your browser.
- What is a tidal datum?
- A datum is the reference level that water heights are measured from. NOAA offers several, such as mean lower low water (MLLW), the nautical chart datum for US coastal waters, so check which one a number refers to.
- What is storm surge?
- It is the extra height of water pushed onto a coast by wind and low pressure during a storm, over and above the normal tide.
- Why can the observed line differ from the tide table?
- Tide tables are astronomical predictions. Weather such as wind and air pressure moves real water levels away from them.