VU Meter Bars Screensaver
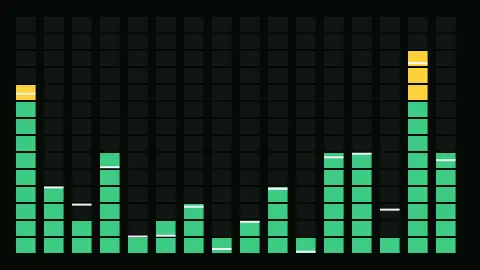
The VU Meter Bars screensaver shows a classic bank of analog VU meter bars, bouncing to a simulated audio rhythm. It is free, runs in your browser, and ESC exits.
Live preview
Press ESC to leave fullscreen. Settings are saved in your browser only.
How the VU Meter Bars screensaver works
The saver drives a bank of vertical meter bars with a layered, simulated rhythm pattern.
Each bar has its own peak-hold marker, exactly like vintage analog stereo equipment.
No real audio is analyzed — the rhythm is generated purely for visual effect.
Colors shift from green through yellow to red as bars climb, like classic VU meter zones.
What a VU meter actually measures
VU stands for volume unit. The meter was developed in 1939 by Bell Telephone Laboratories together with the broadcasters CBS and NBC, and described in a 1940 paper, “A New Standard Volume Indicator and Reference Level”. It was standardised in 1942 as ANSI C16.5, and its behaviour is now also defined in IEC 60268-17. Its defining feature is a deliberately slow response: the rise time to 99% of the distance to 0 VU for a step input is 300 milliseconds, so the needle averages out short peaks and dips.
The meter was built to help operators set signals to a target level, not to measure absolute levels precisely. 0 VU corresponds to +4 dBu, about 1.228 volts RMS. Because it does not show instantaneous peaks, engineers are told that peaks in music or speech sit roughly 6 to 10 dB above the reference level. That is why peak programme meters (PPMs), which the BBC preferred, exist as an alternative.
Modern displays often imitate the old dial with vertical lit bars. Those are closer to a bar-graph level display than to the original moving-needle instrument.
A worked example
A bar surges toward its peak zone, briefly lighting the red segment, before its peak-hold marker settles back down over the next beat.
Settings & tips
- Accent recolours the meter glow.
- No audio is played or analyzed — purely a visual simulation.
- A nostalgic nod to vintage stereo equipment.
Frequently asked questions
- Does this analyze real audio?
- No — the rhythm pattern is simulated, not driven by any real audio input.
- Is a key needed?
- No — it is a pure visual animation.
- Is it free?
- Yes — free, no download, in your browser.
- Can I connect my own music?
- Not currently — this is a self-contained visual simulation.
- What does 0 VU mean?
- It is the reference level on the scale, equal to +4 dBu or about 1.228 volts RMS. The meter helps operators set signals to a target level rather than measuring absolute levels precisely.
- Why do VU meters react slowly?
- Their rise time is 300 milliseconds, so the needle averages out short peaks and dips instead of following every transient.
- What is the difference between a VU meter and a peak meter?
- A VU meter does not show instantaneous peaks, which designers inferred at roughly 6 to 10 dB above the reference level. Peak programme meters respond to peaks directly, and the BBC preferred them.