Denmark's Tables, And Their Starts Screensaver
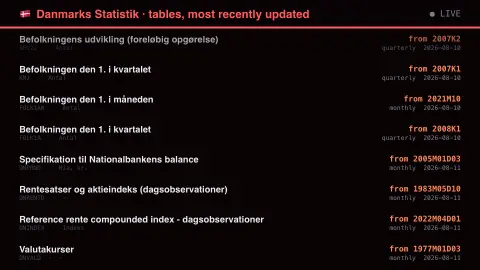
The Denmark's Tables, And Their Starts screensaver shows the Danmarks Statistik table register, key-less. The first period is the field worth reading: 2008K1 means the series begins in the first quarter of 2008, and the notation itself gives the cadence — K for kvartal, M for month, a bare year for annual. A statistics agency's real asset is how far back its series reach unbroken. Titles are Danish and kept that way. It's free, runs in your browser, and ESC exits.
Live preview
Press ESC to leave fullscreen. Settings are saved in your browser only.
How the Denmark's Tables, And Their Starts screensaver works
The saver reads the source described above and draws it on a canvas — no account, no tracking.
The Danmarks Statistik table register, key-less. The first period is the field worth reading: 2008K1 means the series begins in the first quarter of 2008, and the notation itself gives the cadence — K for kvartal, M for month, a bare year for annual. A statistics agency's real asset is how far back its series reach unbroken. Titles are Danish and kept that way.
It refreshes on a schedule, so what you see stays current.
Colours can be changed in settings; nothing is stored beyond your own browser.
Statistics Denmark and its table register
Danmarks Statistik (Statistics Denmark) is Denmark’s central authority on statistics, and StatBank Denmark is its public database of tables. The agency builds most of its statistics on administrative registers kept by other public bodies, such as the Civil Registration System for population figures, with surveys used as a supplement. The Act on Statistics Denmark of 1966 gives it access to data from all public administrative registers.
The register being shown is the list of tables, not the numbers inside them. Each table has a short identifier, such as FOLK1A, which is titled in English “Population at the first day of the quarter by region, sex, age and marital status”. A table is a multi-dimensional grid: region, sex, age, marital status and time are each a dimension, and each cell holds a value.
The start of the series matters because a long unbroken series allows trends to be studied over decades. Even so, breaks occur: Statistics Denmark’s documentation notes that its register-based labour force statistics have had a number of data breaks over time, so values from very different periods are not always strictly comparable. Table titles are Danish, with English titles available on the English site.
A worked example
The Danmarks Statistik table register, key-less. The first period is the field worth reading: 2008K1 means the series begins in the first quarter of 2008, and the notation itself gives the cadence — K for kvartal, M for month, a bare year for annual. A statistics agency's real asset is how far back its series reach unbroken. Titles are Danish and kept that way.
Settings & tips
- Accent and Background recolour the display.
- Every value on screen comes from the live source — nothing is simulated.
- Press ESC to leave fullscreen.
Frequently asked questions
- Is this real data?
- Yes — it comes from the source named on this page and is refreshed on a schedule.
- Is a key needed?
- No. This source is fully key-less.
- Is it free?
- Yes, and it runs entirely in your browser.
- What is in a StatBank table?
- A table is a grid of statistics cross-classified by variables such as time, region, sex and age. You choose which dimensions to display and download.
- Where do the numbers come from?
- Mostly from administrative registers kept by other public bodies, which Statistics Denmark may access under the Act on Statistics Denmark, with surveys as a supplement.
- Is a long series always comparable?
- Not always. Statistics Denmark documents data breaks in some series, for example register-based labour force statistics, so check the table’s documentation before comparing distant periods.