How Long The Dutch Have Counted Screensaver
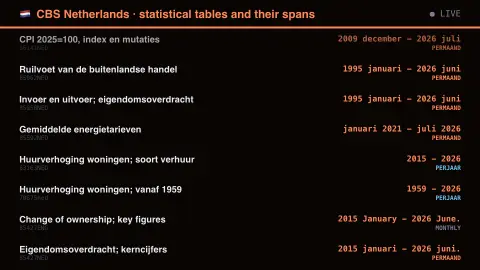
The How Long The Dutch Have Counted screensaver shows the CBS Netherlands statistical table catalogue, key-less. The period column is the reason to look: a table covering 2010-2024 is a series someone kept running for fifteen years, and the frequency says at what cadence. Statistics offices are judged on continuity more than on any single number. Titles are Dutch and left that way — translating a table name is a good way to change what it means. It's free, runs in your browser, and ESC exits.
Live preview
Press ESC to leave fullscreen. Settings are saved in your browser only.
How the How Long The Dutch Have Counted screensaver works
The saver reads the source described above and draws it on a canvas — no account, no tracking.
The CBS Netherlands statistical table catalogue, key-less. The period column is the reason to look: a table covering 2010-2024 is a series someone kept running for fifteen years, and the frequency says at what cadence. Statistics offices are judged on continuity more than on any single number. Titles are Dutch and left that way — translating a table name is a good way to change what it means.
It refreshes on a schedule, so what you see stays current.
Colours can be changed in settings; nothing is stored beyond your own browser.
CBS and the Dutch statistical catalogue
Statistics Netherlands, known by its Dutch name Centraal Bureau voor de Statistiek (CBS), is the national statistical office of the Netherlands and was founded in 1899. It publishes official figures on themes such as population, consumer prices, economic growth, incomes, unemployment and religion, and makes them available through its StatLine database at opendata.cbs.nl. The catalogue lists many tables, each with a title, a short description, a period covered and an update frequency.
The period field is the most telling part of the display. A table spanning many years is a series that has been kept running, which matters because comparable figures across time are what make statistics useful. The frequency shows whether the series is annual, quarterly, monthly or irregular. A table may stop when a survey or classification changes, and a newer table can then continue the topic under a new identifier.
Titles are in Dutch and are shown as published; a good translation needs the context of the technical definition behind the name. A listing here describes what has been published, not the values inside, and a long period does not by itself show that a series is still being updated. For the figures themselves, the full table on the CBS site is the authoritative source.
A worked example
The CBS Netherlands statistical table catalogue, key-less. The period column is the reason to look: a table covering 2010-2024 is a series someone kept running for fifteen years, and the frequency says at what cadence. Statistics offices are judged on continuity more than on any single number. Titles are Dutch and left that way — translating a table name is a good way to change what it means.
Settings & tips
- Accent and Background recolour the display.
- Every value on screen comes from the live source — nothing is simulated.
- Press ESC to leave fullscreen.
Frequently asked questions
- Is this real data?
- Yes — it comes from the source named on this page and is refreshed on a schedule.
- Is a key needed?
- No. This source is fully key-less.
- Is it free?
- Yes, and it runs entirely in your browser.
- What does CBS stand for?
- It stands for Centraal Bureau voor de Statistiek, the Dutch name of Statistics Netherlands.
- Why might a table stop at an earlier year?
- A series can end when a survey or classification changes, with a newer table continuing the topic, or because the data were only collected for a limited time.
- Is the catalogue the same as the data?
- No. The catalogue is the index describing each table. The figures sit inside the tables, which can be opened on the CBS StatLine service.