Spectrum Visualizer Screensaver
The Spectrum Visualizer is a free, in-browser screensaver that looks like an audio equalizer dancing to music. It needs no microphone or audio file — the bars are driven by a simulated beat in code. There is nothing to download, and you press ESC to exit.
Live preview
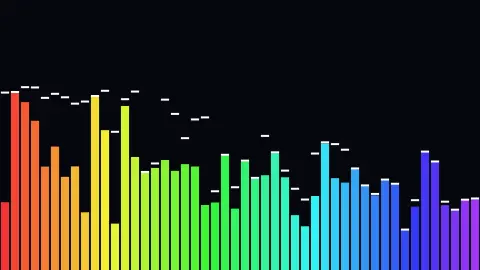
Press ESC to leave fullscreen. Settings are saved in your browser only.
How the Spectrum Visualizer screensaver works
There is no real sound. Each bar's height is synthesized from layered sine waves with a per-bar random phase offset, so neighbors wobble out of step and the row never looks uniform. Lower bars are weighted to carry more energy, mimicking how bass dominates a real spectrum.
A fake bass kick is added on a periodic timer: a sharply pulsed sine raised to a high power gives a brief, punchy spike that mostly lifts the low bars, so the whole visualizer appears to bounce on the beat.
The motion feels physical thanks to fast attack, slow decay. When a bar's target is higher than its current height it jumps up quickly; when the target drops, it eases down gently. A separate peak value rides each bar and falls slowly, which draws the floating peak caps.
The same height data is rendered four ways. Bars grow from the bottom, Mirror reflects them around the center line, Waveform connects them into a single oscillating line, and Circular arranges them radially as spokes around a ring.
How a real audio spectrum is computed
A real spectrum analyser splits a sound into its frequency components. The standard tool is the Fourier transform, and in software the fast Fourier transform, or FFT, which turns a short slice of the waveform into a list of how much energy sits at each frequency. Applying the DFT definition directly costs on the order of n squared operations; FFT algorithms bring that down to roughly n log n, which is what makes redrawing the display many times a second practical.
Two details shape how such displays look. First, pitch is heard roughly logarithmically: every doubling of frequency is an octave, so 100 Hz to 200 Hz sounds like the same interval as 1 kHz to 2 kHz, and good visualisers group bins into bands spaced logarithmically rather than evenly. Second, raw values jump about so much that displays smooth them, with a fast rise when energy appears and a slow fall afterwards, plus peak markers that linger.
Bars on a real analyser carry units, often decibels, whereas decorative ones like this are meant for atmosphere rather than measurement.
A worked example
With the defaults — 48 bars, Bars style, Spectrum colors, Peak caps on, Tempo 5 — forty-eight bars rise from the baseline, each colored by its position along the hue range. Tempo 5 sets how often the bass kick fires, so the low bars punch upward roughly on beat while white peak caps float above and slowly sink toward each bar.
Settings & tips
- Switch Style between Bars, Mirror, Waveform and Circular to completely change the layout from the same beat.
- Lower Tempo for a slow, brooding pulse or raise it toward 10 for a frantic, club-speed bounce.
- Pick a Colors preset (Spectrum, Neon, Fire) or choose Mono and set your own accent color.
Frequently asked questions
- Does the spectrum visualizer react to my music?
- No. It does not use your microphone or any audio file. The bars are driven by a simulated beat generated in code, so it works in silence.
- Is the spectrum visualizer screensaver free?
- Yes. It runs free in your browser with no download, plugin or sign-up needed.
- What visualizer styles are available?
- You can choose Bars, Mirror, Waveform or Circular. Each renders the same simulated levels in a different shape.
- What are the peak caps?
- Peak caps are the small white markers that ride above each bar and slowly drift down, marking the highest level each bar has recently reached.
- How do I exit the spectrum visualizer screensaver?
- Press the ESC key at any time to return to the page.
- What does FFT stand for?
- Fast Fourier transform, an efficient algorithm for computing the discrete Fourier transform of a sequence. The Cooley-Tukey method, published by James Cooley and John Tukey in 1965, made it widely known.
- Why are the bars spaced logarithmically?
- Pitch is perceived in ratios, such as octaves, rather than in equal steps of hertz, so grouping bins into logarithmic bands gives each octave a similar share of the display.
- What is a decibel?
- A logarithmic unit for comparing levels, used because sound intensity spans such a vast range that a linear scale would be impractical.