Solar X-ray Flux Screensaver
The Solar X-ray Flux screensaver shows six hours of one-minute solar X-ray samples from NOAA's key-less GOES feed. Flare class is logarithmic — each letter is ten times the last — so the band lines make an X-class flare legible instead of hiding it. It's free, runs in your browser, and ESC exits.
Live preview
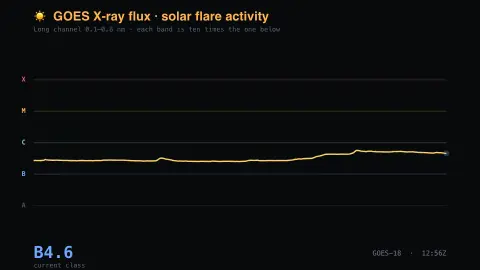
Press ESC to leave fullscreen. Settings are saved in your browser only.
How the Solar X-ray Flux screensaver works
The saver reads NOAA's GOES feed directly in your browser — no key and no account.
Six hours of one-minute solar X-ray samples from NOAA's key-less GOES feed.
It refreshes on a schedule, so what you see stays current.
Colours can be changed in settings; nothing is stored beyond your own browser.
How solar flares are classified
The GOES series of satellites, operated by NOAA, carries X-ray sensors that continuously measure solar X-ray output. Flares are classified by peak flux in the 1 to 8 angstrom band (0.1 to 0.8 nanometres), measured in watts per square metre. NOAA’s Space Weather Prediction Center shows this band as one-minute averages, together with a second, shorter-wavelength band, and takes data from a primary and a secondary GOES satellite.
The classes are A, B, C, M and X, each ten times stronger than the one before: C starts at 10⁻⁶ W/m², M at 10⁻⁵ and X at 10⁻⁴. A number within a class is a multiplier, so an M5 is five times an M1 and the scale is open ended above X. Strong flares ionise the upper atmosphere on the sunlit side of Earth and can degrade or absorb high-frequency radio. NOAA rates such blackouts R1 for M1 up to R5 for X20, and issues an alert at M5.
Gaps in the line can be instrument rather than Sun. NOAA notes data dropouts during instrument calibrations and during satellite eclipses, which cluster around the spring and autumn equinoxes, and the newer GOES-R satellites use a different calibration from earlier ones. A flare on the chart tells you about X-ray brightness, not whether a geomagnetic storm or aurora will follow.
A worked example
Six hours of one-minute solar X-ray samples from NOAA's key-less GOES feed. Flare class is logarithmic — each letter is ten times the last — so the band lines make an X-class flare legible instead of hiding it.
Settings & tips
- Accent and Background recolour the display.
- Data comes straight from NOAA's GOES feed in your browser.
- Press ESC to leave fullscreen.
Frequently asked questions
- Is this real data?
- Yes — it comes from NOAA's GOES feed and is refreshed on a schedule.
- Why the lettered bands?
- Flare class is logarithmic: each letter is ten times the one below. On a linear axis an X-class flare would swamp everything; the bands keep the whole range readable.
- Is a key needed?
- No. This source is fully key-less.
- Is it free?
- Yes — free, no download, in your browser.
- Why is the vertical axis logarithmic?
- Flare classes are each ten times stronger than the last, so flux spans several orders of magnitude. A logarithmic scale lets quiet periods and large flares share one chart.
- Does a big flare mean an aurora is coming?
- Not directly. NOAA links flares to coronal mass ejections, which can lead to geomagnetic storms, but the X-ray flare itself is only the brightness measured at the satellite.
- Why does the line sometimes have gaps?
- NOAA notes that data can drop out during instrument calibrations and during satellite eclipses, which cluster around the equinoxes.