Singapore Heat Map Screensaver
The Singapore Heat Map screensaver shows the island-wide air temperature sensor network from data.gov.sg, station by station, key-less. It's free, runs in your browser, and ESC exits.
Live preview
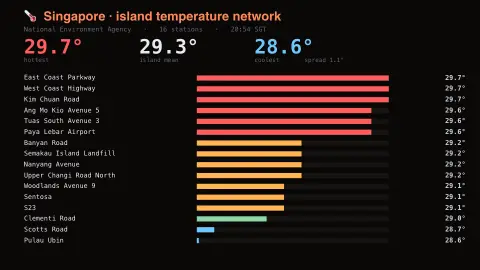
Press ESC to leave fullscreen. Settings are saved in your browser only.
How the Singapore Heat Map screensaver works
The saver reads the source described above and draws it on a canvas — no account, no tracking.
The island-wide air temperature sensor network from data.gov.sg, station by station, key-less. Singapore is small and sits one degree off the equator, so the interesting figure is not the temperature but the spread: the sea-facing coast reads consistently cooler than the middle.
It refreshes on a schedule, so what you see stays current.
Colours and any options can be changed in settings; nothing is stored beyond your own browser.
Singapore's temperature station network
Singapore's weather readings are provided by the National Environment Agency (NEA) on the data.gov.sg portal, in a collection of real-time readings covering temperature, humidity, rainfall and wind at station level, at up to one-minute intervals. Each air temperature reading is in degrees Celsius, and the saver plots stations by location so you see a map of readings instead of a single island-wide figure.
Singapore sits close to the equator, so seasonal swings are small and the spatial differences are more interesting than the timeline. The dataset notes that coastal stations can be affected by the surrounding sea, one reason neighbouring stations can read differently.
Gaps can occur because of technical problems, and values may be corrected later. The data represents recent measurements, not forecasts. Sensors are at specific sites, so a reading describes the air at that station and may differ from what you feel standing in the sun or on a hot pavement.
A worked example
The island-wide air temperature sensor network from data.gov.sg, station by station, key-less. Singapore is small and sits one degree off the equator, so the interesting figure is not the temperature but the spread: the sea-facing coast reads consistently cooler than the middle.
Settings & tips
- Accent and Background recolour the display.
- Every value on screen comes from the live source — nothing is simulated.
- Press ESC to leave fullscreen.
Frequently asked questions
- Is this real data?
- Yes — it comes from the source named on this page and is refreshed on a schedule.
- Is a key needed?
- No. This source is fully key-less.
- Is it free?
- Yes — free, no download, in your browser.
- Why not just show one average temperature?
- Because the spread between stations is the interesting part. Station readings can differ on the same afternoon, and the dataset notes coastal stations can be affected by the sea.
- Why might a station be missing?
- The dataset notes gaps can occur because of technical problems, and values may be corrected later.