Scientific Journals Board Screensaver
The Scientific Journals Board screensaver ranks real scientific and technical journal articles published by country. It is free, runs in your browser, and ESC exits.
Live preview
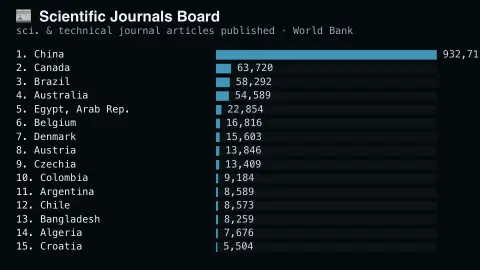
Press ESC to leave fullscreen. Settings are saved in your browser only.
How the Scientific Journals Board screensaver works
The saver reads real scientific and technical journal articles published data from the World Bank's own open data API.
Countries are ranked by their real latest reported journal-article output.
The pipeline refreshes as the World Bank republishes the underlying dataset.
No key is required for this key-less public endpoint.
What the journal-article count measures
The figure behind this board is the World Bank indicator “Scientific and technical journal articles”. The World Bank’s data page credits the US National Science Foundation’s Science and Engineering Indicators as its source. NSF’s publication counts are drawn from the Scopus database and cover peer-reviewed articles and conference papers in science and engineering fields, with filters applied to remove questionable-quality publications.
NSF uses fractional counting: credit for a co-authored paper is split across the collaborating countries in proportion to their authors. A paper with four authors, two in one country and one each in two others, would score 2/4, 1/4 and 1/4. That is why country values are often not whole numbers, and why the totals do not exceed the number of papers, as they would under whole counting, where every contributing country gets a full count.
Output counts say nothing about quality or citation impact, and they depend on what the underlying database indexes. The latest year with data can differ between economies, so the board ranks each country by its most recent reported value rather than a single shared year.
A worked example
A real country's most recent reported journal-article output is ranked against the real others, with bars easing into place as the board loads.
Settings & tips
- This counts scientific and technical journal articles published per country per year.
- Accent recolours the bars and header text.
- Figures come straight from the World Bank's own open data API.
Frequently asked questions
- Is this real data?
- Yes — real scientific and technical journal articles published figures from the World Bank's own open data API.
- Is a key needed?
- No. The World Bank indicators API is fully key-less.
- How often does it update?
- The pipeline re-reads the World Bank's own dataset periodically, on whatever schedule the underlying indicator is republished.
- Is it free?
- Yes — free, no download, in your browser.
- Why are there decimals in a count of articles?
- NSF splits credit for co-authored papers among the countries involved in proportion to their authors (fractional counting), so country totals are rarely whole numbers.
- Where do the article counts originally come from?
- The World Bank credits the US National Science Foundation’s Science and Engineering Indicators. NSF’s publication counts are based on the Scopus database.