R&D Spending Board Screensaver
The R&D Spending Board screensaver ranks real research and development expenditure as a share of GDP by country. It is free, runs in your browser, and ESC exits.
Live preview
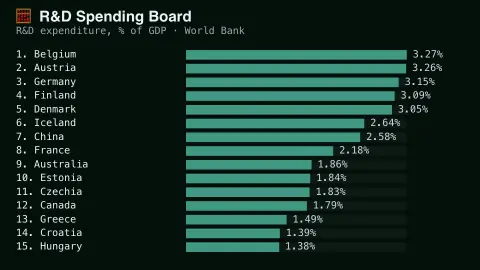
Press ESC to leave fullscreen. Settings are saved in your browser only.
How the R&D Spending Board screensaver works
The saver reads real research and development expenditure as a share of GDP data from the World Bank's own open data API.
Countries are ranked by their real latest reported R&D spending share.
The pipeline refreshes as the World Bank republishes the underlying dataset.
No key is required for this key-less public endpoint.
R&D intensity and what the World Bank counts
Research and development expenditure as a share of GDP, often called R&D intensity, is a standard yardstick for how much of its economic output a country devotes to creating new knowledge and products. The World Bank’s open data indicator for it credits the UNESCO Institute for Statistics as its source.
R&D is defined internationally by the OECD’s Frascati Manual as creative and systematic work undertaken to increase knowledge and to devise new applications of it. The manual distinguishes three types: basic research, aimed at understanding the foundations of phenomena without a specific application in view; applied research, directed at a specific practical goal; and experimental development, which uses existing knowledge to produce new or improved products or processes.
Because the ratio is relative to GDP it adjusts for country size, but it says nothing about how efficiently the money is used or what it produces. Statistical agencies report on different schedules, so the latest available year differs by country and neighbouring entries may refer to different years. National implementation of statistical standards also varies, which limits how exactly countries can be compared.
A worked example
A real country's most recent reported R&D spending share is ranked against the real others, with bars easing into place as the board loads.
Settings & tips
- Spending is shown as a percentage of each country's GDP.
- Accent recolours the bars and header text.
- Figures come straight from the World Bank's own open data API.
Frequently asked questions
- Is this real data?
- Yes — real research and development expenditure as a share of GDP figures from the World Bank's own open data API.
- Is a key needed?
- No. The World Bank indicators API is fully key-less.
- How often does it update?
- The pipeline re-reads the World Bank's own dataset periodically, on whatever schedule the underlying indicator is republished.
- Is it free?
- Yes — free, no download, in your browser.
- Why might two countries show data from different years?
- The board uses each country’s latest reported value, and statistical agencies report on different schedules.
- Does a higher percentage mean better research?
- Not necessarily. It measures spending relative to GDP, not outcomes or quality.
- What counts as research and development?
- Under the OECD’s Frascati definition, creative and systematic work to increase knowledge and devise new applications, covering basic research, applied research and experimental development.