Keeling Curve Screensaver
The Keeling Curve screensaver draws the saw-toothed rise of atmospheric CO₂ measured at Mauna Loa, fresh from NOAA data via the pipeline, with the latest ppm. It's free, runs in your browser, and ESC exits.
Live preview
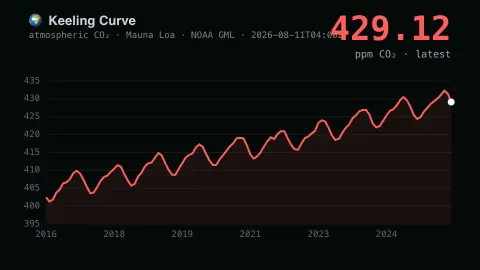
Press ESC to leave fullscreen. Settings are saved in your browser only.
How the Keeling Curve screensaver works
A background pipeline reads NOAA's monthly atmospheric CO₂ record from the Mauna Loa Observatory in Hawaii.
The saver plots it as the famous Keeling Curve — a steady climb with a yearly saw-tooth as plants breathe in and out across the seasons.
The latest reading in parts per million is shown big, with the curve scaled to the recent record.
It refreshes when new monthly data is published.
Charles Keeling and the Mauna Loa record
Charles David Keeling of the Scripps Institution of Oceanography made the first accurate measurements of atmospheric carbon dioxide in the late 1950s and chose Mauna Loa in Hawaii as the site. The observatory sits high on a volcano in the middle of the Pacific, surrounded by bare lava with no nearby vegetation or soil, so the air it samples is a good background reading. Scripps carried on the programme he started, and NOAA runs its own measurements at the same site.
CO₂ is reported as a mole fraction in dry air, in parts per million, so 413 ppm means 413 CO₂ molecules for every million molecules of air once water vapour is removed. Dry air is used because the figure is then unaffected by humidity or by air expanding with altitude. The saw-tooth comes from the seasons: northern-hemisphere plants take up CO₂ while growing and release it as they decay, putting a yearly swing on top of the long upward trend caused largely by burning fossil fuels.
Recent monthly values are subject to change after quality-control checks, though NOAA expects any revisions to be small. Mauna Loa is one station, and the curve measures concentration in the air, not emissions, and does not by itself say how much warming follows.
A worked example
The red curve climbs from the left, each year a little saw-tooth notch, the latest point glowing past 420 ppm — the measurement Charles Keeling began in 1958 that first revealed CO₂ rising year on year.
Settings & tips
- Accent recolours the curve.
- Background sets the chart backdrop.
- Run
automation/run.py co2on your pipeline machine to refresh the record.
Frequently asked questions
- Is the data real?
- Yes. It's NOAA's monthly Mauna Loa CO₂ record, gathered by the pipeline, so the curve and latest ppm are the official figures.
- What is the Keeling Curve?
- The continuous record of atmospheric CO₂ begun by Charles Keeling at Mauna Loa in 1958 — the graph that revealed the steady global rise.
- Why is the curve jagged?
- CO₂ dips each northern summer as plants grow and rises each winter, giving the long climb its yearly saw-tooth.
- Why does it use a pipeline?
- NOAA's data file isn't browser-readable directly, so a small background script fetches it and saves a snapshot.
- Is it free?
- Yes — free, no download, in your browser.
- Why measure CO₂ on a volcano?
- Mauna Loa is remote and high, with bare lava around it and no nearby vegetation or soil, so its air is representative of a broad region rather than a nearby city or forest. NOAA also identifies periods when emissions from the volcano itself affect the readings.
- Does a monthly figure ever get revised?
- Yes. NOAA says monthly values are subject to change after quality-control checks, and that any revisions are expected to be small.
- Why is the yearly saw-tooth there?
- Plants in the northern hemisphere, which has much of the world’s land, absorb CO₂ in the growing season and release it as they decay, so the concentration dips and rises each year.