Hypocentre Globe Screensaver
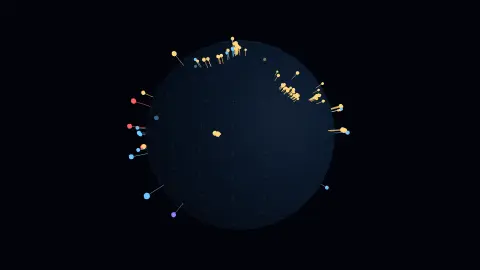
The Hypocentre Globe screensaver plots every earthquake of the last day on a translucent Earth at its true depth below the surface, live from the USGS. It runs in the browser with nothing to install; press ESC to exit.
Live preview
Press ESC to leave fullscreen. Settings are saved in your browser only.
How the Hypocentre Globe screensaver works
The saver renders with three.js on your GPU. The library is vendored into this site rather than fetched from a CDN, and is loaded only when a 3D screensaver actually runs.
It reads the USGS earthquake feed, which is public and needs no key.
The scene resizes with the window and releases its WebGL context when the saver stops, so shuffle mode and Multi-view can cycle 3D savers without exhausting the browser's context limit.
If WebGL is unavailable the saver says so on screen rather than showing an empty black box.
Why earthquake depth is a different dimension
Earthquakes are usually mapped as dots on a flat chart, but each one begins at a point beneath the surface called the hypocentre, also known as the focus. The spot on the surface directly above it is the epicentre. The USGS describes reading depth from depth phases such as pP, a wave reflected off the surface near the source, whose delay after the direct P wave grows with depth. Depth estimates are generally less certain than the horizontal location.
Depth is not random. Quakes occur from the surface down to roughly 700 kilometres. The USGS groups them as shallow (0 to 70 km), intermediate (70 to 300 km) and deep (300 to 700 km). The deepest events happen inside the cold cores of subducting oceanic slabs, with examples beneath Japan, Kamchatka and Tonga, and plotted in three dimensions they trace out the tilted slab, a pattern called a Wadati-Benioff zone.
The data comes from the USGS, which draws on seismic networks and agencies around the world. Event pages mark each solution as automatic or reviewed by an analyst, so a recent event’s parameters can change. The USGS aims for global completeness only around magnitude 4.5, so small events in sparsely instrumented regions may be missing, and a sparse area on the globe does not mean a quiet one.
A worked example
Each quake is a spike running from its hypocentre outward through the crust: the inner end sits at real depth, the outer end pokes out by magnitude. Shallow events are gold, intermediate ones blue, and anything below 300 km violet. Because the globe is translucent, the deep swarms are visible inside it — and they are not scattered. They form sheets dipping beneath the continents, which is the shape of a subducting plate.
Settings & tips
- Accent and Background recolour the scene; Speed changes the pace of both the motion and the camera.
- Add it to a Multi-view grid, though 3D savers are heavier than the 2D ones and a few per screen is plenty.
- Press ESC at any time to leave fullscreen.
Frequently asked questions
- Why does depth matter?
- Because it separates completely different events. A magnitude 6 at 5 km can level a town; the same magnitude at 600 km is a slab of old ocean floor breaking apart far below anyone, and is often not felt at all. A flat map draws them identically.
- How current is it?
- It is the USGS feed of the past 24 hours, refetched every ten minutes. On a normal day that is several hundred events, most of them too small to feel.
- Does this need a special browser or plugin?
- No. It uses WebGL, which every current desktop and mobile browser supports. Nothing is installed and no plugin is required.
- Does it cost anything or need an account?
- No. Every screensaver here is free, runs in the browser and needs no sign-up.
- What is the difference between an epicentre and a hypocentre?
- The hypocentre is the point underground where the rupture begins. The epicentre is the point on the surface directly above it.
- Why are deep earthquakes only found in certain places?
- They occur within subducting slabs, the cold oceanic plates sinking into the mantle, as beneath Japan, Kamchatka and Tonga. The USGS gives about 700 km as the maximum depth.
- Are reported depths exact?
- No. Depth is generally less certain than the horizontal location, and the USGS marks events as automatic or reviewed, so a first estimate can be revised.