Global Wind Screensaver
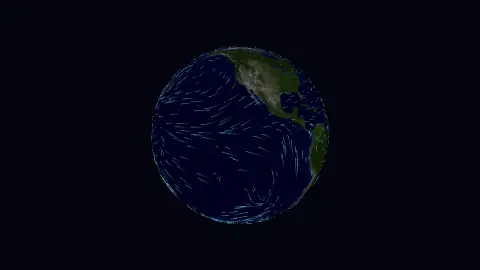
The Global Wind screensaver advects particles across a globe using real wind speed and direction measured at 84 points around the world. It runs in the browser with nothing to install; press ESC to exit.
Live preview
Press ESC to leave fullscreen. Settings are saved in your browser only.
How the Global Wind screensaver works
The saver renders with three.js on your GPU. The library is vendored into this site rather than fetched from a CDN, and loads only when a 3D screensaver actually runs.
It reads Open-Meteo, which returns the whole grid in a single key-less request.
The scene resizes with the window and releases its WebGL context when the saver stops, so shuffle mode and Multi-view can cycle 3D savers without exhausting the browser's context limit.
If WebGL is unavailable the saver says so on screen rather than showing an empty black box.
Why the winds of the world form bands
The pattern of global wind is organised by the rotation of the Earth. Warm air rises near the equator and flows towards the poles at height, but because the planet spins, moving air is deflected, to the right in the northern hemisphere and to the left in the southern: the Coriolis effect. The result is a set of surface belts: easterly trade winds in the tropics, westerlies in the mid-latitudes and polar easterlies near the poles.
These circulation cells are the Hadley, Ferrel and polar cells in each hemisphere. The Hadley cell follows the zone of greatest heating, moving north around June and July and south around December and January. Sailors learned the belts long before the physics: Portuguese navigators used the trades to sail west and northwest away from Africa, and the strong southern westerlies known as the Roaring Forties, between about 40 and 50 degrees south, gave fast passages eastward. Actual weather is far less tidy, with storms, monsoons and the jet stream adding variation to the average pattern.
Open-Meteo supplies wind speed and direction at point locations, and a particle display spreads those out across the globe. The streaming particles show where air is heading, not a measured field everywhere, since in-between areas are filled in from the sampled locations. Wind near the surface is also influenced by terrain, so local conditions can differ from the broad flow on screen.
A worked example
Particles are seeded across the sphere and pushed by the field sampled from the nearest grid point, leaving a streak behind them coloured by speed. The large-scale pattern emerges: westerlies running left to right through the mid latitudes, trade winds running the other way nearer the equator. The grid is coarse on purpose — the whole field arrives in one request, which is the difference between a screensaver and a weather product.
Settings & tips
- Accent and Background recolour the scene; Speed changes the pace of the motion and the camera.
- Add it to a Multi-view grid, though 3D savers are heavier than 2D ones and a few per screen is plenty.
- Press ESC at any time to leave fullscreen.
Frequently asked questions
- Why nearest-point rather than smooth interpolation?
- Because 84 samples do not justify it. Interpolating smoothly would invent detail the data does not contain and imply a resolution that is not there. Nearest-sample is honest about the grid being coarse.
- Which way does the wind blow?
- Meteorological convention reports the direction wind comes from, not where it goes. The saver adds 180° before moving anything, which is a classic way to get a wind map exactly backwards.
- Does this need a special browser or plugin?
- No. It uses WebGL, which every current desktop and mobile browser supports. Nothing is installed and no plugin is required.
- Does it cost anything or need an account?
- No. Every screensaver here is free, runs in the browser and needs no sign-up.
- What is the Coriolis effect?
- An apparent deflection of moving air caused by the rotation of the Earth. It bends winds to the right in the northern hemisphere and to the left in the southern.
- Why are the westerlies stronger in the south?
- There is very little land at those latitudes to act as a windbreak, so the flow meets few obstacles. The Roaring Forties, between about 40 and 50 degrees south, are the best-known example.
- Are the trade winds always blowing?
- They are persistent, not constant. They are stronger in winter than in summer, and the cells that drive them shift north and south with the seasons.