Global Freight Rate Index Screensaver
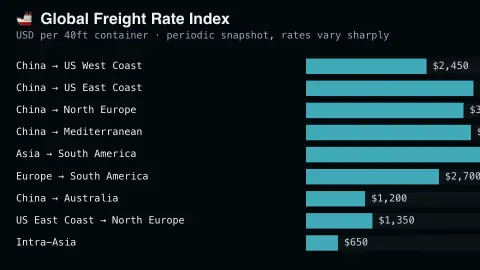
The Global Freight Rate Index screensaver shows a real snapshot of container shipping freight rates by major global trade route, from published freight-index data. It is free, runs in your browser, and ESC exits.
Live preview
Press ESC to leave fullscreen. Settings are saved in your browser only.
How the Global Freight Rate Index screensaver works
The saver displays a real, curated snapshot of container shipping freight rates across major global trade routes.
Each route shows its real reported price per container, in U.S. dollars.
The board refreshes periodically as new real freight-index reports are published.
No live feed is required — figures are a real, curated periodic snapshot.
What a container freight rate actually prices
Container freight indices turn a messy market into a handful of comparable numbers. They gather rate assessments for individual trade lanes, such as Shanghai to Rotterdam or Shanghai to Los Angeles, and publish a benchmark price for moving a container. Different indices use different units: Drewry's World Container Index, for example, is published weekly in US dollars per 40-foot container across eight major East-West trades.
An index is a price for the sea leg on a given route and does not include everything that goes into delivering goods. Trucking, port charges at either end, customs and insurance are separate costs, and what each index counts differs, so figures from different publishers should not be compared directly. Spot rates, which apply to cargo booked at short notice, can also move far more than the long-term contract rates many large shippers agree in advance.
Rates can swing sharply when demand surges, when ports become congested or when routes are disrupted by closures or conflict that force ships onto longer voyages. Because benchmarks are published at intervals, such as weekly, they trail rather than lead the market, and a drop in an index does not mean consumer prices will fall at once.
A worked example
A real spike in shipping costs on a major route, caused by a real disruption like a canal closure, is reflected in the board at the next refresh.
Settings & tips
- Accent recolours the route bars.
- Rates are a real periodic snapshot, not a tick-by-tick live feed.
- Freight rates vary widely by route and container type in the real market.
Frequently asked questions
- Is this real shipping data?
- Yes — real reported freight rates from published index reports.
- Is a key needed?
- No — figures are a curated real periodic snapshot.
- How current are the rates?
- As current as the most recent real periodic content update.
- Is it free?
- Yes — free, no download, in your browser.
- What is a TEU or FEU?
- TEU means twenty-foot equivalent unit and FEU means forty-foot equivalent unit, standard ways of counting container volume. Indices quote prices per 40-foot container or per TEU depending on the publisher.
- Are these prices what importers actually pay?
- Only roughly. Many large importers pay negotiated contract rates, and the final cost also includes charges that a benchmark leaves out.
- Why do some routes cost more than others?
- Distance, demand and port conditions all matter, and each trade lane is assessed separately, so their prices can move differently.