The Galton Board Screensaver
The Galton Board is a free screensaver that runs a bean machine: beads drop through rows of pegs, bounce left or right on a fair coin flip at each peg, and collect in bins that gradually form the bell-shaped binomial distribution. It shows the live count, mean and spread against the exact theory, and ESC exits.
Live preview
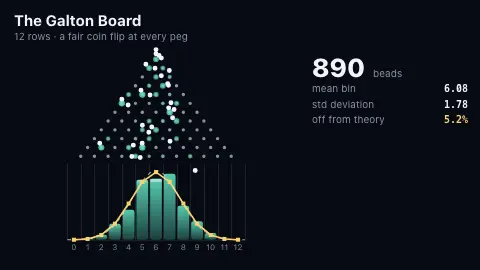
Press ESC to leave fullscreen. Settings are saved in your browser only.
How the The Galton Board screensaver works
Beads fall through a triangle of pegs. At every peg a bead is knocked half a peg-spacing to the left or right, and which way is decided by one coin flip, Math.random() < 0.5. That is a pseudo-random generator, not a physical coin, but it is fair to a very good approximation, and every flip is made independently for every bead at every peg.
After n rows a bead has bounced right some number k of times between 0 and n, and it drops into bin k. There are 2^n equally likely left-right paths and C(n, k) of them end in bin k, so a bead lands in bin k with probability C(n, k) / 2^n, a binomial distribution with mean n/2 and standard deviation sqrt(n)/2. The histogram on screen is a count of the beads that really landed; nothing is drawn from the curve.
The gold line is the exact expected count in each bin for the number of beads so far, and the dashed line is the normal (bell-curve) approximation to it. The panel shows the number of beads, the mean and sample standard deviation of the bin number with their exact values underneath, and the total-variation distance: half the sum of the gaps between each bin's share of beads and its exact probability. 0% would be a perfect match.
That distance shrinks as beads accumulate, roughly like one over the square root of the count, but it never settles at exactly zero, because the beads are random. A run fills to the chosen number of beads, holds so the shape can be read, drains, and starts again.
Galton and the quincunx
The board is named after Francis Galton, who presented it in a Royal Institution discourse on 27 February 1874 and described it again, with a diagram, in his 1889 book Natural Inheritance. He called the device a quincunx and used it to show how a bell-shaped spread of outcomes can arise from many small independent chances (Wikipedia, "Galton board", checked against its citations of those two dates).
The board is a standard classroom picture of the central limit theorem: as the number of rows and beads grows, the binomial histogram approaches the normal distribution. This saver draws the exact binomial probabilities for comparison, computed from Pascal's triangle, so you can watch random beads converge on a known answer.
Real boards have friction, spin and beads that bounce off more than one peg; this one does not, and it uses a computer's pseudo-random numbers rather than physical chance.
A worked example
With 12 rows there are 4,096 equally likely paths and 13 bins, numbered 0 to 12. The middle bin, 6, can be reached by C(12,6) = 924 of them, so it takes 924 / 4,096 = 22.6% of beads: about 226 in a run of 1,000. Bins 5, 6 and 7 together hold 792 + 924 + 792 = 2,508 paths, 61% of the beads. Bin 0 needs twelve left bounces in a row, 1 path in 4,096, so a 1,000-bead run expects only 0.24 beads there. The mean is 6 and the standard deviation is √12 / 2 ≈ 1.73.
Settings & tips
- Rows of pegs sets n, from 6 to 20; more rows give a wider, smoother curve.
- Bead rate and Beads per run set how fast and how long a run fills.
- Show theory curve turns the gold binomial line and dashed normal curve on or off.
- Press ESC to leave fullscreen.
Frequently asked questions
- Is this a physics simulation?
- The motion is animated to look like beads bouncing, but there is no collision physics. What is exact is the statistics: each bead's path is a sequence of independent fair coin flips, so the landing bin follows the binomial distribution exactly.
- Why does it make a bell curve?
- Each bead's final position is the sum of many small independent left or right steps. Sums of many independent steps pile up in a bell shape, which is the central limit theorem; the binomial distribution approaches the normal as the number of rows grows.
- Why doesn't the histogram match the theory exactly?
- Because the beads are random. With a few hundred beads each bin wobbles by several percent either side of its expected count. The gap shrinks as the count grows but is never exactly zero.
- Are the coin flips truly random?
- They come from the browser's pseudo-random number generator (Math.random), which is not a physical source of randomness but is statistically fair enough that you cannot see the difference at this scale.
- What does the off-from-theory percentage mean?
- It is the total-variation distance between the bead histogram and the exact binomial probabilities: half the sum of the absolute differences between each bin's share of beads and its exact probability. 0% is a perfect match; 100% would be no overlap at all.
- Can the pegs be biased?
- Not in this saver. Every peg is a fair 50-50 flip, so the curve is always symmetric around the middle bin.