Who Drowns Screensaver
The Who Drowns screensaver ranks countries by deaths from flooding per 100,000 people, using the most recent year on record for each country. It runs in the browser with nothing to install; press ESC to exit.
Live preview
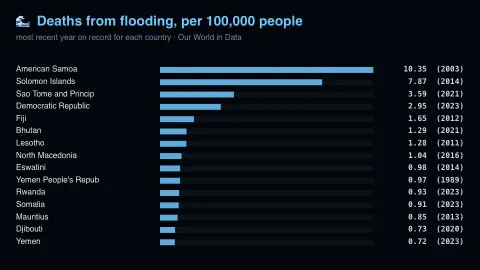
Press ESC to leave fullscreen. Settings are saved in your browser only.
How the Who Drowns screensaver works
The saver reads Our World in Data's public indicator API, key-free.
No account and no key: the request goes straight from your browser, or from this site's own refreshed copy of the feed where the source does not permit browser access.
Values are drawn on a canvas that resizes with the window, so it works on a laptop or a wall display.
If the source is unreachable the saver says so on screen rather than showing stale numbers as though they were current.
Flood deaths per capita, from Our World in Data
Our World in Data is a collaboration: the non-profit Global Change Data Lab owns and maintains the website and data tools, while University of Oxford researchers, affiliated with the Oxford Martin Programme on Global Development, write its content. Its charts are built from original sources and normalised, for example into deaths per 100,000 people, so that a small country and a large one can be compared.
Disaster deaths there come from EM-DAT, the International Disasters Database kept by the Centre for Research on the Epidemiology of Disasters (CRED) at UCLouvain. EM-DAT counts deaths as confirmed deaths plus missing people. An event is recorded at country level if it meets at least one of four criteria: 10 or more deaths, 100 or more people affected, a declared state of emergency, or a call for international assistance.
The data have limits. Flood is a broad category covering riverine, coastal, flash and glacial lake outburst floods. Floods are irregular, so a single disaster can swing a small country's rate, and Our World in Data offers decadal averages alongside annual values for that reason. The figures do not measure how often floods happen or how much property is damaged.
A worked example
Fifteen countries ranked highest first, each with its rate and the year the figure comes from. Rates rather than counts is what makes the comparison meaningful: a flood killing two hundred people in a country of two million is a national catastrophe, while the same toll in a country of two hundred million barely registers in absolute terms.
Settings & tips
- Accent and Background recolour the display without changing the data.
- Add it to a Multi-view grid to watch it alongside other live savers.
- Press ESC at any time to leave fullscreen.
Frequently asked questions
- Why does the year differ by country?
- Because reporting does. The saver takes each country's most recent available observation rather than forcing a common year, which would discard most of the data.
- Why are aggregates like Africa excluded?
- Because they are not countries and would outrank every individual country in a list sorted by size. The API marks them by leaving the country code empty, which is how the saver filters them out.
- Is this real data?
- Yes. It comes from Our World in Data's public indicator API, key-free. Nothing is invented or simulated, and if the source cannot be reached the saver reports that instead of drawing something plausible.
- Does it cost anything or need an account?
- No. Every screensaver here is free, runs in the browser and needs no sign-up. This one uses a public API that requires no key.
- Why use a rate rather than a total?
- A total depends largely on population size. A rate per 100,000 people makes countries of different sizes more comparable.
- Why can a single year distort a country's figure?
- Floods are irregular, so one major disaster can raise a small country's rate sharply. Our World in Data therefore also offers a decadal average alongside annual values.
- Do these numbers show which places flood most often?
- No. They measure recorded deaths relative to population, not how frequently flooding occurs or how much damage it causes.