Live Earthquake Map Screensaver
The Live Earthquakes screensaver plots recent earthquakes from the USGS feed onto a world map in real time, each one a pulsing ring sized and coloured by magnitude. It refreshes every few minutes and scrolls a ticker of the latest events. It's free, runs in your browser, and ESC exits.
Live preview
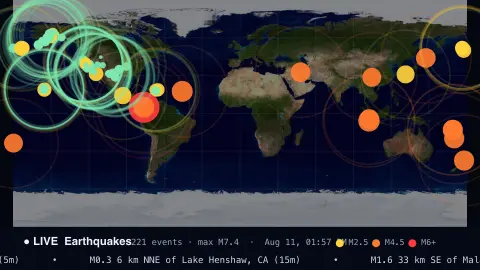
Press ESC to leave fullscreen. Settings are saved in your browser only.
How the Live Earthquakes screensaver works
Every few minutes the saver fetches the United States Geological Survey's public earthquake feed — a GeoJSON file the USGS updates continuously. Each quake comes with a magnitude, a place name, a time and a longitude/latitude.
Those coordinates are projected straight onto an equirectangular world map: longitude runs left to right, latitude top to bottom, so each quake's dot sits exactly where it happened on Earth.
Every quake is drawn as a pulsing ring that expands and fades on a loop, with a solid dot at the centre. The radius scales with magnitude and the colour steps from green (minor) through yellow and orange to red (major), so the biggest events stand out.
A status bar tallies the events and the strongest magnitude, shows a colour legend, and scrolls a ticker of the most recent quakes with how long ago each struck.
Magnitude, depth and the USGS catalogue
The United States Geological Survey operates the National Earthquake Information Center and publishes earthquake data in near real time. Its catalogue draws on contributing seismic networks, so it includes events well outside the United States, though how completely small tremors are recorded depends on local instrument coverage. Regions with dense networks report many more minor quakes than remote ones.
Magnitude is a logarithmic scale. According to the USGS, each whole-number step is a tenfold increase in measured amplitude on a seismogram and corresponds to about 32 times more energy released. Moment magnitude is now the more accurate measure for most earthquakes, while the older Richter local magnitude is still used for small, locally recorded events. Alongside magnitude, each record has a depth below the surface and a location given as latitude and longitude with a descriptive place name.
Early reports are preliminary. Magnitude, location and depth are often revised as more data arrives, and different agencies can list the same event with slightly different figures. A map of recent quakes also shows geology: clusters trace tectonic plate boundaries, such as the ring around the Pacific, rather than random scatter.
A worked example
With the window on Past day and no magnitude filter, a typical view shows a few hundred quakes worldwide — mostly small green dots clustered along plate boundaries like the Pacific 'Ring of Fire', with the occasional orange M4–5. Raise Min magnitude to 4.5 and the map clears to just the significant events; switch to Past week (M4.5+) to see the week's major earthquakes at a glance.
Settings & tips
- Time window chooses the USGS feed: past hour, past day, or a week of larger quakes.
- Raise Min magnitude to hide the constant background of tiny tremors and focus on big ones.
- Ticker speed sets how fast the latest-events strip scrolls along the bottom.
Frequently asked questions
- Is the earthquake data real and live?
- Yes. It comes straight from the USGS public earthquake feed and refreshes every few minutes, so you're seeing real quakes reported in roughly real time.
- What do the colours mean?
- Colour tracks magnitude: green is under 2.5, yellow up to 4.5, orange up to 6, and red is magnitude 6 and above. Dot size grows with magnitude too.
- Does it need an internet connection?
- Yes, it fetches live data from the USGS, so it needs to be online. Opened from a local file with no connection, it shows a short notice instead.
- Can I see only large earthquakes?
- Yes. Raise the minimum magnitude slider, or pick one of the magnitude-filtered time windows, to hide the constant background of tiny tremors.
- Is this earthquake screensaver free?
- Yes, completely free and browser-based, with nothing to install. Press Run fullscreen and press ESC to exit.
- Is a magnitude 6 twice as strong as a magnitude 3?
- Far more. The scale is logarithmic, so each whole number is about 32 times the energy, and three steps is tens of thousands of times.
- Why do magnitudes get changed after the event?
- The first estimate uses limited data, and further seismic stations and more careful analysis refine the figures.
- Why does the catalogue show more small quakes in some regions?
- Small quakes are only recorded where instruments are close enough to detect them, so regions with dense seismic networks list many more minor events than remote ones.