Corruption Perceptions Index Screensaver
The Corruption Perceptions Index screensaver ranks countries by Transparency International's real, published Corruption Perceptions Index — the world's benchmark public-sector integrity ranking. It's free, runs in your browser, and ESC exits.
Live preview
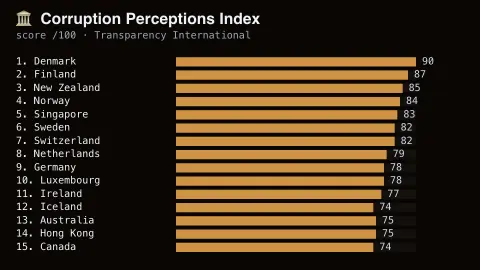
Press ESC to leave fullscreen. Settings are saved in your browser only.
How the Corruption Perceptions Index screensaver works
Countries rank top to bottom by their real published Corruption Perceptions Index score.
Each bar is sized to scale against the highest-scoring country.
Choose how many countries appear on the board at once.
Figures are real published annual data, updated as Transparency International releases each year's index.
Scoring perception: how the CPI is assembled
The Corruption Perceptions Index is published each year by Transparency International. It scores countries and territories from 0 to 100, where 0 means the public sector is perceived as highly corrupt and 100 means it is perceived as very clean. It measures perceived public-sector corruption, and it does not measure dirty money flows.
Importantly, the index measures perception. Corruption is hidden by nature, so the CPI instead combines data from 13 corruption surveys and assessments collected by institutions such as the World Bank and the World Economic Forum. A country needs data from at least 3 of those sources to be ranked; absence from the index does not mean a country is corruption-free. Each source is rescaled using the global mean and standard deviation from 2012, which is why scores can be compared from 2012 onward.
Several cautions follow. A change is treated as statistically significant when a majority of the underlying sources reflect it, so small year-to-year fluctuations usually are not meaningful. Ranks can shift because other countries moved rather than because a country itself changed, which is why the score is a better guide than position.
A worked example
You'll see the real highest-scoring countries — typically several Nordic nations — leading the board, each score reflecting Transparency International's own published annual index.
Settings & tips
- Countries shown sets how many bars appear.
- Accent recolours the bars.
- A higher score means perceived cleaner public-sector governance; it's a perception index, not a crime statistic.
Frequently asked questions
- What does the index measure?
- Real perceived levels of public-sector corruption, compiled by Transparency International from multiple expert and business surveys.
- Is a key needed?
- No — it's a static, real-reference-data visualization with no live fetch.
- Is this an official government ranking?
- No — it's Transparency International's independent, widely cited annual index, not a government-produced statistic.
- Is it free?
- Yes — free, no download, in your browser.
- Why is the index based on perceptions?
- Because corruption is hidden, so the CPI combines assessments from 13 surveys and expert sources as the best available proxy.
- Does a score of 100 mean there is no corruption?
- No. It means the public sector is perceived as very clean in these sources, not that corruption is absent.
- Are small changes in a score meaningful?
- Usually not on their own. Transparency International treats a change as significant when a majority of sources reflect it, so multi-year trends are more informative.