Home Price Index Tracker Screensaver
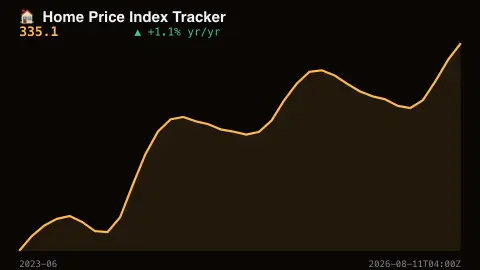
The Home Price Index Tracker screensaver shows the real, live U.S. national home price index, tracked over time from the Federal Reserve's own public economic data. It is free, runs in your browser, and ESC exits.
Live preview
Press ESC to leave fullscreen. Settings are saved in your browser only.
How the Home Price Index Tracker screensaver works
The saver reads the real S&P Case-Shiller U.S. National Home Price Index from the Federal Reserve's own public data series.
The real index value and its real change over the past year are shown alongside a real historical trend line.
The pipeline refreshes the series on its own schedule, matching the index's real monthly release.
No key is required for the published series.
What the Case-Shiller index measures
The S&P Cotality Case-Shiller indices (formerly branded CoreLogic) were developed in the 1980s by economists Karl Case and Robert Shiller, using the repeat-sales method. Rather than averaging asking prices, the method tracks homes that have sold more than once and measures how much each one changed in price, which helps separate market movement from the fact that different houses sell in different months. The Federal Reserve Bank of St. Louis republishes the national series through FRED.
The reading is an index, not a price in dollars. It is scaled so that January 2000 equals 100, so a value of 300 means prices are roughly three times that baseline level, not that a house costs 300 of anything. The yearly change shown is the percentage difference between this month’s index and the same month a year earlier.
Each monthly value is a three-month moving average, built from sales pairs found in that month and the two before it, which smooths noise but delays turning points. FRED’s headline series is not seasonally adjusted, and a separate seasonally adjusted series is listed. National figures also hide large differences between cities and regions, and publication trails the period it describes by a couple of months.
A worked example
A real month-over-month uptick in the published index shows up in the real trend line and the real year-over-year change figure at the next refresh.
Settings & tips
- Accent recolours the trend line.
- The index is real and nationally aggregated, not a single-city figure.
- The index updates monthly on the source's own real schedule.
Frequently asked questions
- Is this real housing data?
- Yes — the real published S&P Case-Shiller U.S. National Home Price Index.
- Is a key needed?
- No. It is a free, public economic data series.
- How current is it?
- As current as the index's real monthly release schedule.
- Is it free?
- Yes — free, no download, in your browser.
- Why is the value an index and not a dollar price?
- The repeat-sales method measures the change in price of the same homes over time, so it produces a relative scale set to 100 in January 2000 rather than an average sale price.
- Why does the latest reading seem months old?
- Each value is a three-month moving average and the series is published with a lag of a couple of months, so it describes a period already in the past.
- Is the series seasonally adjusted?
- The FRED series CSUSHPINSA is not seasonally adjusted. FRED lists a separate seasonally adjusted series, CSUSHPISA.