Climate Projection Screensaver
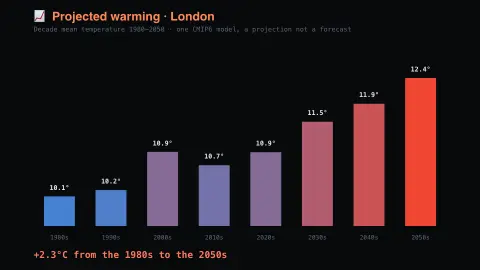
The Climate Projection screensaver shows modelled daily mean temperature for a place, collapsed into decade averages out to 2050, from Open-Meteo's key-less climate API. This is one CMIP6 model's projection, not a forecast and not a certainty. It's free, runs in your browser, and ESC exits.
Live preview
Press ESC to leave fullscreen. Settings are saved in your browser only.
How the Climate Projection screensaver works
The saver reads Open-Meteo's climate API directly in your browser — no key and no account.
Modelled daily mean temperature for a place, collapsed into decade averages out to 2050, from Open-Meteo's key-less climate API.
It refreshes on a schedule, so what you see stays current.
Colours can be changed in settings; nothing is stored beyond your own browser.
Climate models behind the decade averages
Open-Meteo's climate API serves output from a set of global climate models run for the CMIP6 project, specifically the high-resolution models of the HighResMIP working group. Its documentation lists seven models, including EC_Earth3P_HR, MRI_AGCM3_2_S and NICAM16_8S, with native resolutions from about 20 to 51 kilometres, which Open-Meteo downscales to a 10 km grid. A global model divides the atmosphere into grid cells and simulates physics forward in time.
Averaging into decades is the sensible way to read the output. A model run does not predict the weather on a given day; its individual days are plausible examples of weather, not forecasts, so daily values are dominated by random variability. Averaging over ten years smooths this noise so that the underlying trend in the climate becomes visible. The data runs from 1950 to 2050.
Several cautions apply. One model is only one estimate, and different models can disagree on the size of a regional change. Grid cells smooth out local effects such as mountains, coastlines and cities. Open-Meteo says its models follow a high-emissions pathway, as close to RCP8.5 as CMIP6 allows. The bars are therefore best read as an indication of direction and rough size of change for the area, not a precise number for a specific street.
A worked example
Modelled daily mean temperature for a place, collapsed into decade averages out to 2050, from Open-Meteo's key-less climate API. This is one CMIP6 model's projection, not a forecast and not a certainty.
Settings & tips
- Accent and Background recolour the display.
- Data comes straight from Open-Meteo's climate API in your browser.
- Press ESC to leave fullscreen.
Frequently asked questions
- Is this real data?
- Yes — it comes from Open-Meteo's climate API and is refreshed on a schedule.
- Is this a forecast?
- No. It is one CMIP6 model's projection, shown as decade averages because a single projected day carries no information. The signal is in the trend, not any one value.
- Is a key needed?
- No. This source is fully key-less.
- Is it free?
- Yes — free, no download, in your browser.
- Why use decade averages and not yearly values?
- Year-to-year variability is large compared with the long-term trend, and averaging over ten years reduces that noise.
- What is CMIP6?
- The sixth phase of the Coupled Model Intercomparison Project, in which climate modelling groups run common experiments so results can be compared.
- Why might a local temperature differ from the projection?
- Models use grid cells that miss local features such as elevation, coastlines and urban heat, so a place can differ from its cell average.