Climate Normals Screensaver
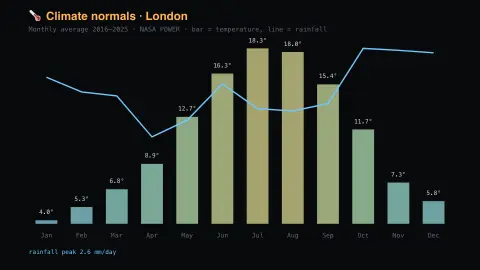
The Climate Normals screensaver shows ten years of monthly temperature and rainfall for a place, averaged into a climatology, from NASA's key-less POWER project. Bars are temperature, the trace is rainfall. It's free, runs in your browser, and ESC exits.
Live preview
Press ESC to leave fullscreen. Settings are saved in your browser only.
How the Climate Normals screensaver works
The saver reads NASA POWER directly in your browser — no key and no account.
Ten years of monthly temperature and rainfall for a place, averaged into a climatology, from NASA's key-less POWER project.
It refreshes on a schedule, so what you see stays current.
Colours can be changed in settings; nothing is stored beyond your own browser.
Where a modelled climate average comes from
POWER stands for Prediction Of Worldwide Energy Resources, a NASA project that grew out of the earlier Surface meteorology and Solar Energy (SSE) dataset, first released in 1997 for renewable-energy design. The POWER project began in 2002 and added data sets for sustainable buildings and agroclimatology. Its meteorological parameters are based on the MERRA-2 reanalysis and its solar parameters on satellite observations, not on a single weather station.
The saver pulls ten years of monthly values of temperature and rainfall for a chosen location, then averages each calendar month across those years. The result is a climatology: the typical shape of a year, such as a warm wet season and a cool dry one, rather than a forecast or a record of any specific year.
The meteorological grid is one-half degree of latitude by five-eighths of a degree of longitude, so each value stands for an area tens of kilometres across and smooths out local effects like hills, coasts and cities. A nearby weather station may read noticeably different. Ten years is also shorter than the 30-year averaging period the World Meteorological Organization uses for its standard climate normals, so one unusual year can shift the average. Treat the chart as an approximate profile of a place's seasonal rhythm.
A worked example
Ten years of monthly temperature and rainfall for a place, averaged into a climatology, from NASA's key-less POWER project. Bars are temperature, the trace is rainfall.
Settings & tips
- Accent and Background recolour the display.
- Data comes straight from NASA POWER in your browser.
- Press ESC to leave fullscreen.
Frequently asked questions
- Is this real data?
- Yes — it comes from NASA POWER and is refreshed on a schedule.
- Is a key needed?
- No. This source is fully key-less.
- Is it free?
- Yes — free, no download, in your browser.
- Is this the same as a weather station reading?
- No. POWER meteorological values come from the MERRA-2 reanalysis on a grid, so they describe an area rather than a point and may differ from a local station.
- Why ten years rather than thirty?
- Ten years is the span the saver averages. The World Meteorological Organization's standard climate normals use 30 years, so a ten-year climatology is shorter and a single unusual year has more influence on it.
- Where does the data come from?
- From NASA's POWER project, which bases its meteorological parameters on the MERRA-2 reanalysis and its solar parameters on satellite observations.