Canadian River Levels Screensaver
The Canadian River Levels screensaver shows live hydrometric gauges from Environment and Climate Change Canada, key-less. It's free, runs in your browser, and ESC exits.
Live preview
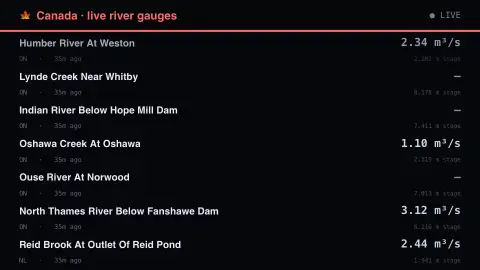
Press ESC to leave fullscreen. Settings are saved in your browser only.
How the Canadian River Levels screensaver works
The saver reads the source described above and draws it on a canvas — no account, no tracking.
Live hydrometric gauges from Environment and Climate Change Canada, key-less. Joins the site's USGS and Environment Agency river savers as a third national network, and the only one of the three reporting level and discharge together on nearly every station.
It refreshes on a schedule, so what you see stays current.
Colours and any options can be changed in settings; nothing is stored beyond your own browser.
How a river gauge works
Environment and Climate Change Canada’s Water Survey of Canada operates most of Canada’s hydrometric stations on behalf of provinces and territories under federal-provincial and federal-territorial agreements; Quebec operates its own stations. Stations on rivers and lakes record two main quantities: water level, and discharge, the volume of water passing a point each second.
Level is the quantity a sensor actually measures, logged continuously by a data logger. Discharge is not measured directly. It is calculated from level using a stage-discharge model (a rating curve) that technologists build from direct flow and level measurements taken at the station several times a year. Ice can raise water levels without a matching rise in flow, which breaks the relationship, so ice-affected data are flagged and computed flow is typically too high.
The values shown are real-time readings, which the Water Survey marks provisional: best available and subject to change until they are confirmed as final. Water level is often reported as gauge height above an assumed local datum, so it is not the water’s depth or its height above sea level, and one station’s number cannot be compared with another’s directly. The display illustrates conditions, not flood forecasts or warnings.
A worked example
Live hydrometric gauges from Environment and Climate Change Canada, key-less. Joins the site's USGS and Environment Agency river savers as a third national network, and the only one of the three reporting level and discharge together on nearly every station.
Settings & tips
- Accent and Background recolour the display.
- Every number on screen comes from the live source — nothing is simulated.
- Press ESC to leave fullscreen.
Frequently asked questions
- Is this real data?
- Yes — it comes from the source named on this page and is refreshed on a schedule.
- Is a key needed?
- No. This source is fully key-less.
- Is it free?
- Yes — free, no download, in your browser.
- Why can I not compare water levels between two stations?
- Level is often reported as gauge height above an assumed local reference, not depth or height above sea level, so a higher number at one place does not mean a higher river than at another.
- Are these official flood warnings?
- No. They are provisional real-time observations that can change. For flood warnings, check the official sources for your area.