Two Exchanges, One Market Screensaver
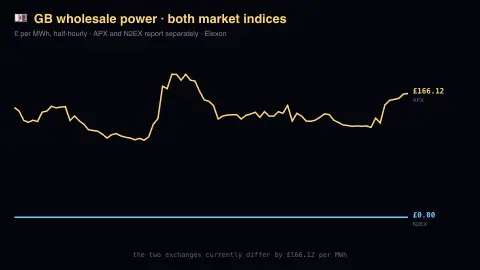
The Two Exchanges, One Market screensaver plots the GB wholesale electricity price from both reporting exchanges — APX and N2EX — over two days, in pounds per megawatt-hour. It runs in the browser with nothing to install; press ESC to exit.
Live preview
Press ESC to leave fullscreen. Settings are saved in your browser only.
How the Two Exchanges, One Market screensaver works
The saver reads Elexon's BMRS market index feed, key-free.
No account and no key: the request goes straight from your browser, or from this site's own refreshed copy of the feed where the source does not permit browser access.
Values are drawn on a canvas that resizes with the window, so it works on a laptop or a wall display.
If the source is unreachable the saver says so on screen rather than showing stale numbers as though they were current.
Britain's wholesale power price, half-hour by half-hour
Elexon administers the Balancing and Settlement Code for Great Britain, and its Balancing Mechanism Reporting Service (BMRS) publishes the operational data behind those arrangements. One BMRS dataset is Market Index Data: for each settlement period, each market index data provider supplies a market index price and a market index volume. The two providers are APX and N2EX, and the data also feeds the calculation of system buy and sell prices.
Electricity is traded and settled in settlement periods of half an hour, which follow local time and start at midnight. A normal day has 48, and the days when the clocks change have 46 or 50. Prices are in pounds per megawatt-hour, the unit of wholesale energy trading; one megawatt-hour is a thousand kilowatt-hours, so dividing by a thousand gives a figure comparable with a per-kWh unit rate.
Wholesale price is only one part of a household bill. Ofgem’s price cap also covers network costs, policy costs, operating costs, a supplier margin allowance and VAT, and many tariffs are fixed for a set term. The market index is an indicator of wholesale trading in each half hour; it is not the price any given supplier or generator ultimately settles at.
A worked example
Two lines, one per exchange, each labelled with its current price. They usually track each other closely; the interesting moments are the gaps, when the two order books clear differently under stress. The footer states the current difference between them directly.
Settings & tips
- Accent and Background recolour the display without changing the data.
- Add it to a Multi-view grid to watch it alongside other live savers.
- Press ESC at any time to leave fullscreen.
Frequently asked questions
- Why are there two prices?
- Because Britain has no single power exchange. APX and N2EX both run day-ahead and intraday markets and both report a volume-weighted index, and Elexon publishes each. Neither is more official than the other.
- Can the price go negative?
- Yes. When generation exceeds demand and cannot be turned down quickly, prices can clear below zero and generators pay to keep producing. The chart keeps the zero line visible for exactly that reason.
- Is this real data?
- Yes. It comes from Elexon's BMRS market index feed, key-free. Nothing is invented or simulated, and if the source cannot be reached the saver reports that instead of drawing something plausible.
- Does it cost anything or need an account?
- No. Every screensaver here is free, runs in the browser and needs no sign-up. This one uses a public API that requires no key.
- Why is the price in pounds per megawatt-hour?
- That is the unit used for wholesale energy. One megawatt-hour is a thousand kilowatt-hours, so divide by a thousand to compare with a per-kWh figure on a household bill.
- What is a settlement period?
- It is the half-hour block used to trade and settle electricity in Great Britain. A normal day has 48, a clocks-forward day 46 and a clocks-back day 50.
- Does a low wholesale price mean my bill is lower?
- Not directly. A bill also includes network, policy and operating costs, a supplier margin and VAT, and fixed-term tariffs do not move with day-to-day wholesale prices.