Oil Rig Count Screensaver
The Oil Rig Count screensaver charts the real Baker Hughes rig count — the oil and gas industry's benchmark measure of active North American drilling activity, published weekly since 1944. It's free, runs in your browser, and ESC exits.
Live preview
Press ESC to leave fullscreen. Settings are saved in your browser only.
How the Oil Rig Count screensaver works
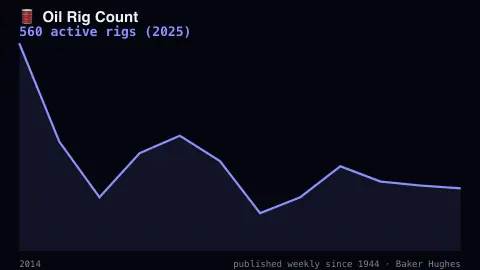
The chart plots real published Baker Hughes rig count history over recent years.
The most recent real count and its recent trend are shown alongside the chart.
Figures are real industry reference data, refreshed periodically as new weekly counts publish.
This is a real historical reference series, not a live tick-by-tick feed.
What the Baker Hughes rig count counts
Baker Hughes, an oilfield services company, has published rotary rig counts as a service to the petroleum industry since 1944. The North American count is released weekly at noon Central on the last working day of the week, usually Friday, though holidays can shift it. It tallies rigs actively drilling for oil or natural gas and is treated by analysts as a leading indicator of demand for oilfield products and services. An international count is published monthly.
The count is of rigs actively drilling, not of wells producing or of barrels of oil. That distinction matters because it measures activity rather than output, and rigs drilling now affect production only after wells are completed. Companies decide how many rigs to run after weighing prices and costs, which is why the series tends to track the industry’s mood.
The series covers the United States and Canada. Canadian counts have a strong seasonal pattern: Western Canadian rig counts usually start falling around March as spring breakup approaches, because thawing ground restricts the movement of heavy equipment. The chart is a reference time series of industry activity and says nothing about where energy prices are going.
A worked example
The chart's swings track real oil-price cycles — rig counts climb when drilling is profitable and fall when producers pull back, a genuine industry pattern spanning decades.
Settings & tips
- Accent recolours the chart line.
- The count covers active drilling rigs across the U.S. and Canada.
- Baker Hughes has published this real benchmark weekly since 1944, the industry's oldest rig-count series.
Frequently asked questions
- Is the data real?
- Yes — it's based on Baker Hughes' own real, industry-standard rig count, published since 1944.
- Is this a live feed?
- No — it's real reference data updated periodically, similar to the site's Glacier Watch; Baker Hughes itself publishes weekly, every Friday.
- Is a key needed?
- No — it uses real published reference data with no live fetch.
- Is it free?
- Yes — free, no download, in your browser.
- Why does the Canadian count drop every spring?
- During spring breakup the ground thaws, which restricts the movement of heavy equipment, so drilling and rig moves slow down. Western Canadian counts usually start falling around March.
- Does a falling rig count mean falling production?
- Not directly. The count measures rigs actively drilling, not wells producing or barrels pumped, so production can move differently from the rig count.
- When is the rig count published?
- The North American count is released weekly at noon Central on the last working day of the week, usually Friday, although holidays can shift it.