Nuclear Reactor Status Board Screensaver
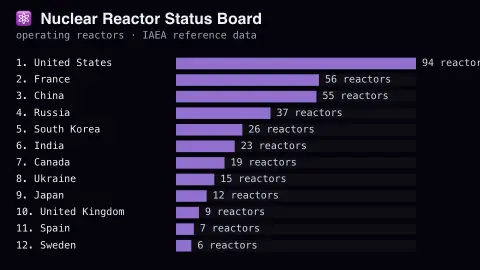
The Nuclear Reactor Status Board screensaver shows the world's operating nuclear reactor fleet by country with real capacity figures, curated from the IAEA's Power Reactor Information System. It's free, runs in your browser, and ESC exits.
Live preview
Press ESC to leave fullscreen. Settings are saved in your browser only.
How the Nuclear Reactor Status Board screensaver works
Countries rank by real number of operating reactors and total real generating capacity.
Each bar is sized to scale against the largest nuclear fleet.
Choose how many countries appear on the board at once.
Figures are real IAEA reference data, updated periodically as the fleet changes.
Counting the world's reactors
The International Atomic Energy Agency maintains the Power Reactor Information System, or PRIS, a database of nuclear power reactors and their status. This board ranks countries by the number of operating reactors and by total generating capacity, with bars scaled to the largest fleet.
Capacity is given in megawatts electric, MWe, the electrical output of a reactor as opposed to the heat it produces, and a national total is the sum across its operating units. The two measures do not always agree: a country with many small reactors can have a higher count than one with fewer large units but lower capacity. PRIS tracks status separately from operation: a unit counts as operational only after its first grid connection, while units under construction, permanently shut down, or in extended shutdown (which PRIS calls suspended operation) are kept in other categories.
Capacity is not generation. A reactor's actual output over a year depends on refuelling outages, how it is run and grid demand, so installed capacity says what a fleet could produce, not what it did. The board is a periodic snapshot; reactors start up and retire, so figures change slowly over the years.
A worked example
At the top you'll see the United States, France and China leading real reactor counts and capacity — genuine IAEA-tracked figures, not estimates.
Settings & tips
- Countries shown sets how many bars appear.
- Accent recolours the bars.
- The real fleet changes slowly — new reactors and retirements happen over years, not days.
Frequently asked questions
- Where does the data come from?
- The International Atomic Energy Agency's Power Reactor Information System, the real global reference database.
- Is a key needed?
- No — it's a static, real-reference-data visualization with no live fetch.
- Does this show reactor output?
- It shows real installed generating capacity, not live moment-to-moment output.
- Is it free?
- Yes — free, no download, in your browser.
- Is capacity the same as electricity produced?
- No. Capacity is the output the units are rated for, while actual generation depends on outages, refuelling and demand.
- What does MWe mean?
- Megawatts of electrical output, as opposed to thermal power, which is the heat the reactor produces and is larger than the electricity it delivers.
- Are reactors under construction counted?
- No. Only units with an operational status are included, so new builds appear only after they connect to the grid.