Bifurcation Diagram Screensaver
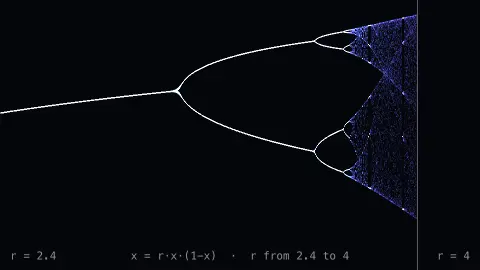
Bifurcation Diagram is a free, in-browser screensaver that draws the logistic map’s bifurcation diagram, one column per value of the growth rate r. For each r the map x → r·x·(1−x) is run until the transient dies and the values it then visits are plotted: a single steady state that splits into two, four, eight and on into chaos, with clean periodic windows inside the chaos. The diagram draws itself left to right, then zooms into the cascade and the period-three window and back out. Nothing to download, and ESC exits at any time.
Live preview
Press ESC to leave fullscreen. Settings are saved in your browser only.
How the Bifurcation Diagram screensaver works
The logistic map is the simplest model of a population with limited resources: next year’s share x is r times this year’s share times the room left, 1 − x. For r below 3 it settles to one value. At r = 3 that value splits into an alternating pair; at about 3.449 the pair splits into four; at 3.544 into eight; and the splits arrive faster and faster until at r ≈ 3.5699 the behaviour becomes chaotic.
Each screen column is one value of r across the current window. The map is iterated 120 times from x = 0.5 to discard the transient, then 160 more times with every value plotted as a faint point, so a period-2 orbit puts down two bright dots and a chaotic orbit smears a band.
Inside the chaos are windows of order, the widest at r ≈ 3.83 where the orbit has period three — Li and Yorke’s “period three implies chaos”. Each window contains a miniature copy of the whole diagram, which the zoom views visit.
The ratio of successive splitting intervals converges to 4.669…, the Feigenbaum constant, and it is the same for a huge family of maps; the cascade views are chosen to show that self-similarity.
A road to chaos
The logistic map became famous through Robert May’s 1976 review in Nature (volume 261, page 459), which examined how simple first-order difference equations can behave in very complicated ways. May presented it partly as a discrete-time model of population growth, and showed that raising the growth rate could turn a stable value into a cycle and then into something irregular.
The diagram’s most interesting feature lies inside the chaotic region. Narrow clear bands appear where the behaviour becomes periodic again; the widest is a period-three window, which opens at r = 1 + √8 ≈ 3.8284. A 1975 paper by Tien-Yien Li and James Yorke, “Period Three Implies Chaos”, proved that if a continuous map of an interval has a cycle of period three, it has cycles of every other length too. Each window contains a miniature copy of the whole diagram.
The picture ends at r = 4. Above that, almost all starting values eventually leave the interval from zero to one and the map stops being a sensible population model; only a sparse set of points stays behind. The period-doubling points are exact enough to compute: the first split is at r = 3, the second at 1 + √6 ≈ 3.449, and the splits accumulate near r ≈ 3.5699.
A worked example
At the defaults — Speed 4, Ice palette — a single bright line drawn from the left splits into a fork just past the first third of the screen, forks again and again in ever tighter succession, and dissolves into a mottled band with a conspicuous clear gap of three lines near the right edge. When it completes, the view zooms to 3.4–3.6 and the cascade redraws at ten times the detail, then deeper still, then to the period-3 window, then back out.
Settings & tips
- Speed 1 lets you watch each fork appear column by column.
- Fire palette makes the chaotic bands read as heat.
- Turn the caption on to see the r-range of each zoom.
Frequently asked questions
- What is a bifurcation diagram?
- A plot of the long-term states of a system against a control parameter. For the logistic map the parameter is the growth rate r, and the diagram records which values x keeps returning to at each r — one value, then two, then four, then a chaotic band.
- What is the Feigenbaum constant?
- The limiting ratio between the widths of successive period-doubling intervals, approximately 4.6692. Mitchell Feigenbaum found in 1975 that it is universal: any smooth map with a single hump doubles its period at the same geometric rate.
- Will this slow my computer down?
- It is tuned to run smoothly on an ordinary laptop. If it feels heavy, raise the Pixel size or lower the speed in the settings; every control takes effect immediately.
- Is the Bifurcation Diagram screensaver free?
- Yes. It runs free in your browser with nothing to download or install, and it keeps working offline once the page has loaded.
- How do I exit the Bifurcation Diagram screensaver?
- Press the ESC key at any time to leave fullscreen and return to the page.
- What are the empty bands inside the chaos?
- They are periodic windows, ranges of r where the map locks onto a repeating cycle again. The widest one is a cycle of length three, starting at about r = 3.8284.
- Why does the diagram stop at r = 4?
- For r above four, almost all starting values eventually leave the interval from zero to one and diverge, so the population interpretation breaks down.
- Does this model real animal populations?
- May presented it partly as a discrete-time demographic model, but it is a deliberately simple one. Real populations involve many more factors, so treat it as a teaching model.