Life Expectancy Gap Screensaver
The Life Expectancy Gap screensaver shows life expectancy at birth country by country, from the WHO Global Health Observatory, gathered key-less by the pipeline. It's free, runs in your browser, and ESC exits.
Live preview
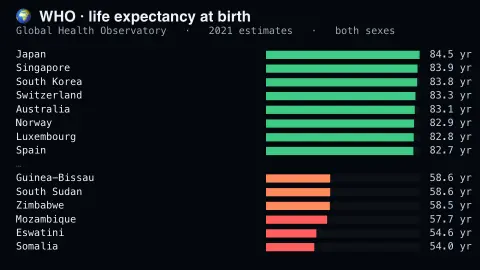
Press ESC to leave fullscreen. Settings are saved in your browser only.
How the Life Expectancy Gap screensaver works
The saver reads the source described above and draws it on a canvas — no account, no tracking.
Life expectancy at birth country by country, from the WHO Global Health Observatory, gathered key-less by the pipeline. Annual estimates, so it moves once a year — but the spread it shows, more than thirty years between the top and bottom of the table, is the point.
It refreshes on a schedule, so what you see stays current.
Colours and any options can be changed in settings; nothing is stored beyond your own browser.
What life expectancy at birth means
The WHO Global Health Observatory is the World Health Organization’s data portal for health indicators. Life expectancy at birth is one of them: the average number of years a newborn could expect to live if the sex- and age-specific death rates of a given period stayed the same throughout life. It is a summary of mortality at all ages in that period, not a forecast for any individual.
WHO builds the figures from age- and sex-specific mortality rates, preferably from civil registration with complete coverage, and otherwise from household surveys and population censuses, to compute abridged life tables. Its metadata notes that these estimates may differ from the figures countries publish themselves. Because the number averages deaths across all ages, high mortality among infants and children pulls it down sharply, and a low value does not mean adults routinely die at that age.
Each value is an estimate for a single year, and new estimate releases arrive only periodically, so the table changes slowly. The measure says nothing about quality of life, nor about differences inside countries, which can be larger than gaps between them.
A worked example
Life expectancy at birth country by country, from the WHO Global Health Observatory, gathered key-less by the pipeline. Annual estimates, so it moves once a year — but the spread it shows, more than thirty years between the top and bottom of the table, is the point.
Settings & tips
- Accent and Background recolour the display.
- Every value on screen comes from the live source — nothing is simulated.
- Press ESC to leave fullscreen.
Frequently asked questions
- Is this real data?
- Yes — it comes from the source named on this page and is refreshed on a schedule.
- Is a key needed?
- No. This source is fully key-less.
- Is it free?
- Yes — free, no download, in your browser.
- Does a life expectancy of 60 mean most people die at 60?
- No. It is an average that reflects deaths at all ages, so a country with high child mortality can have a low value even if many adults live much longer.
- Why does the data change so slowly?
- Each figure is an estimate for a past year, built from mortality statistics and published in periodic WHO releases rather than in real time.
- Are these numbers measured directly?
- Not as a single count. WHO calculates life tables from death-registration data where coverage is complete, and from household surveys and censuses where it is not.