Global Conflict Event Map Screensaver
The Global Conflict Event Map screensaver plots real coded geopolitical events on a world map, refreshed from GDELT's live event export. It is free, runs in your browser, and ESC exits.
Live preview
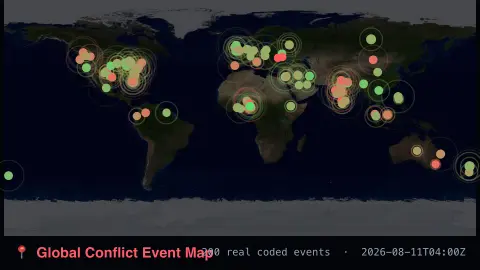
Press ESC to leave fullscreen. Settings are saved in your browser only.
How the Global Conflict Event Map screensaver works
The saver reads GDELT's own real 15-minute event export, a live feed of coded global events.
Each point is a real event with real actor names, a real location and a real cooperation/conflict score.
The pipeline refreshes the map every time GDELT publishes a new 15-minute export.
No key is required for this key-less public export.
How GDELT turns news into coded events
GDELT, the Global Database of Events, Language, and Tone, monitors news media from around the world and uses automated software to extract who did what to whom, when and where. Each extracted event is stored in a table, and the GDELT 2.0 event data are updated every 15 minutes, including events drawn from news in 65 languages that are translated live. Events are coded with the CAMEO taxonomy, a hierarchy of more than 300 event types recorded as numeric codes.
Several fields in each record matter for reading the display. The two actors are the parties named in the story, an event code gives the kind of action, and the Goldstein score is a value from -10 to +10 estimating the theoretical potential impact of that type of event, from conflictual to cooperative. It depends on the event type, so a small riot and a large one score the same. A mentions count records how many articles mention the event, and latitude and longitude place it on the map.
Because everything is extracted by machine from news text, the data carry the biases and mistakes of both. Places in a story can be tagged to the wrong location, one real incident can appear as several records, and heavily covered regions produce more events than quiet ones. A dot is a report of an event, not a confirmed fact, and the map should be read as a picture of media attention.
A worked example
A real event between two named real actors, geocoded to its real reported location, appears on the map exactly as GDELT logged it minutes earlier.
Settings & tips
- Events are real GDELT-coded records, not simulated incidents.
- Accent recolours the event markers.
- The Goldstein score reflects GDELT's real -10 to +10 conflict-cooperation scale.
Frequently asked questions
- Is this real event data?
- Yes — real coded events from the GDELT Event Database's live export.
- Is a key needed?
- No. GDELT's 15-minute export files are fully key-less.
- How current is the data?
- GDELT publishes a real new export every 15 minutes, worldwide.
- Is it free?
- Yes — free, no download, in your browser.
- What does the Goldstein score mean?
- It is a value from -10 to +10 attached to each CAMEO event type, estimating that type of event's theoretical potential impact, with violent conflict at the negative end and cooperation at the positive end. It is set by event category, not measured for the particular case.
- Does more dots in a region mean more conflict?
- Not necessarily. Counts follow how much the news covers a place and in which languages, so they reflect coverage as much as events.