German Grid Generation Screensaver
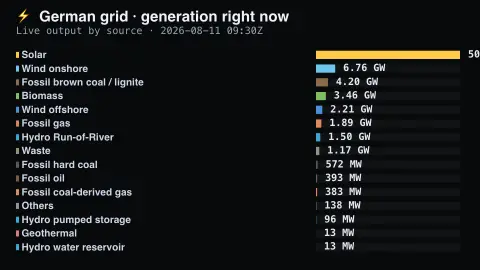
The German Grid Generation screensaver shows what is actually producing Germany's electricity right now, by source, from Energy-Charts at Fraunhofer ISE. Cross-border trade and storage draw are filtered out, so every row is real generation. It's free, runs in your browser, and ESC exits.
Live preview
Press ESC to leave fullscreen. Settings are saved in your browser only.
How the German Grid Generation screensaver works
The background pipeline reads this from Energy-Charts at Fraunhofer ISE and saves a snapshot the saver loads.
What is actually producing Germany's electricity right now, by source, from Energy-Charts at Fraunhofer ISE.
It refreshes on a schedule, so what you see stays current.
Colours can be changed in settings; nothing is stored beyond your own browser.
Energy-Charts and the shape of a grid
Energy-Charts is an online energy data platform from the Fraunhofer Institute for Solar Energy Systems (Fraunhofer ISE) in Freiburg, Germany. It presents German electricity data in interactive charts. Its chart pages credit several sources, including ENTSO-E (the European network of transmission system operators), AGEE-Stat, Destatis, AG Energiebilanzen and Fraunhofer ISE itself, and the live generation charts cover the net generation of power plants for public power supply.
Each row on the board is a production type with a power value in megawatts, a measure of instantaneous output rather than energy over time. Sources include wind, solar, hydro, biomass, gas, hard coal, lignite (brown coal) and pumped storage. Germany's mix swings quickly with the weather: solar peaks around midday, wind can surge at any hour, and thermal plants fill the gaps.
Primary data from ENTSO-E is occasionally corrected after publication, so recent figures can change slightly once revisions arrive. The board shows the mix of generation inside Germany at one moment; it says nothing about prices, cross-border flows or the annual total, which can look very different from a single snapshot.
A worked example
What is actually producing Germany's electricity right now, by source, from Energy-Charts at Fraunhofer ISE. Cross-border trade and storage draw are filtered out, so every row is real generation.
Settings & tips
- Accent and Background recolour the display.
- Run
automation/run.py energychartsto refresh the feed. - Press ESC to leave fullscreen.
Frequently asked questions
- Is this real data?
- Yes — it comes from Energy-Charts at Fraunhofer ISE and is refreshed on a schedule.
- Why don't the numbers add up to demand?
- Because cross-border trade and pumped-storage draw are filtered out. Every row here is real generation, so imports and storage flows are deliberately excluded.
- Is a key needed?
- No. This source is fully key-less.
- Is it free?
- Yes — free, no download, in your browser.
- What is a megawatt?
- A rate of power equal to one million watts. A large wind turbine can produce a few megawatts at full output.
- Why does solar disappear from the list at night?
- Photovoltaic panels only generate when there is daylight, so their output drops to zero after sunset and the other sources cover demand.
- Can the figures change later?
- Yes. Source data is sometimes corrected retrospectively, so numbers shown live may differ slightly from the final record.