Flu Surveillance Curve Screensaver
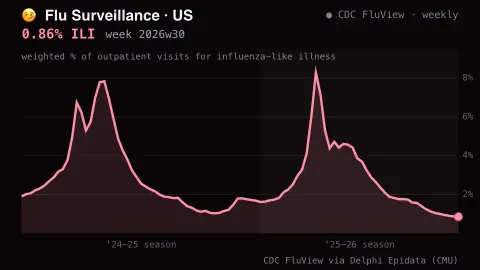
The Flu Surveillance Curve screensaver plots the real CDC FluView series — the weighted percentage of US outpatient visits for influenza-like illness, week by week — fetched in your browser from the key-less Delphi Epidata API at Carnegie Mellon. It's free, needs an internet connection, and ESC exits.
Live preview
Press ESC to leave fullscreen. Settings are saved in your browser only.
How the Flu Surveillance Curve screensaver works
The saver queries the Delphi Epidata API (api.delphi.cmu.edu) directly from your browser for national FluView data — no key, no pipeline.
It computes the CDC epiweek range itself, asking for the last one to three flu seasons from each season's week-40 start.
The weekly weighted-ILI percentage is drawn as one continuous curve with alternating season shading, so each winter's peak stands out against the summer floor.
The headline shows the latest reported rate and its epiweek; surveillance is compiled weekly and lags by a week or more, and recent weeks can be revised.
What influenza-like illness surveillance captures
FluView is the CDC's weekly report on influenza activity. The curve shown comes from ILINet, the U.S. Outpatient Influenza-like Illness Surveillance Network, in which about 4,000 outpatient providers across all 50 states, Puerto Rico, the District of Columbia and the U.S. Virgin Islands report weekly counts of ILI visits and of total visits. ILI is defined as fever of 100°F (37.8°C) or greater plus a cough and/or a sore throat. The national weighted percentage combines state data weighted by state population.
Because ILI is defined by symptoms rather than lab confirmation, it counts a mix of causes. Influenza drives the winter peak, but other respiratory viruses can also produce flu-like symptoms, so the curve reflects more than influenza alone. The CDC pairs it with laboratory data for virus-specific information.
The surveillance season begins in epidemiologic week 40 and ends in week 39 of the following year. Delphi's API labels weeks as six-digit epiweeks such as 201501, and values are preliminary: providers may report late or correct data, so the most recent week is the least certain. The figure measures the share of outpatient visits, not the number of infections.
A worked example
In mid-January the curve typically climbs past 4–5% before rolling over in February — set three seasons of history and you can compare this winter's peak against the last two at a glance. In summer it flattens near 1%, which is exactly what the current 0.87% ILI style headline looks like.
Settings & tips
- Seasons of history — how many flu seasons to plot, from just the current one to three back-to-back for peak-to-peak comparison.
Frequently asked questions
- Is this real surveillance data?
- Yes. It's the CDC's US Outpatient Influenza-like Illness Surveillance Network (ILINet) series as republished by the Delphi Epidata project at Carnegie Mellon — credited on screen as CDC FluView via Delphi Epidata (CMU).
- Does it need an API key?
- No. The Delphi Epidata API is public, key-less and CORS-enabled, so the browser fetches it directly.
- How current is it?
- FluView is compiled weekly and published with a lag of a week or more, and recent weeks are often revised as late reports arrive — so it's a live official series, not a realtime tracker.
- Does it work offline?
- No. It fetches the surveillance series over the internet; offline it shows a short notice instead of stale numbers.
- What does the ILI percentage mean?
- The weighted share of outpatient doctor visits where the patient had fever plus cough or sore throat — a symptom-based signal of flu activity, not a count of confirmed influenza cases.
- Does a higher percentage mean more people have the flu?
- Not exactly. It means a larger share of outpatient visits were for flu-like symptoms, which can include other viruses and is influenced by who chooses to see a doctor.
- Why does the season start around week 40?
- The CDC surveillance season runs from epidemiologic week 40 to week 39 of the next year, so a winter peak sits inside one season instead of being split across two.
- Where does the data pass through before it reaches the screen?
- The CDC collects it from reporting providers, and the Delphi research group at Carnegie Mellon University provides programmatic access through its Epidata API. The saver displays what that service returns.