Road Traffic Deaths Board Screensaver
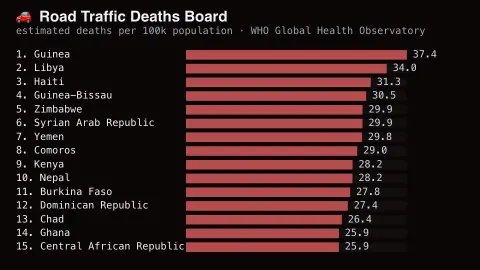
The Road Traffic Deaths Board screensaver ranks countries by their real estimated road-traffic death rate per 100,000 people, from the WHO Global Health Observatory. It's free, needs an internet connection, and ESC exits.
Live preview
Press ESC to leave fullscreen. Settings are saved in your browser only.
How the Road Traffic Deaths Board screensaver works
The pipeline gathers the WHO Global Health Observatory's own road-safety indicator (RS_198, estimated deaths per 100,000 population) into a local feed.
The board ranks the 15 hardest-hit countries and eases each bar toward its real value.
Each row shows the country and its latest estimated death rate — real, unedited WHO figures.
The saver re-reads the feed hourly; the underlying WHO estimates update on the WHO's own release schedule.
Reading WHO road-safety estimates
The World Health Organization publishes estimates of road-traffic deaths for countries through its Global Health Observatory, where the indicator is titled estimated road traffic fatal injury deaths per 100,000 population. The same estimates feed WHO's Global status report on road safety, whose 2023 edition appeared in December 2023. A rate lets countries of very different size be compared, unlike a raw count that mostly tracks population.
The estimates are not simple tallies. WHO sorts countries by the data they have. Where death registration is at least 80 per cent complete, registration figures are used. Where registration exists but has gaps, WHO applies statistical adjustment such as capture-recapture. Countries without eligible registration data are estimated with a negative binomial regression model. National focal points and road-safety experts also review country data.
Because the figures are modelled and harmonised by WHO, they can differ from numbers published by national authorities. A rate also reflects many things beyond road building, such as the mix of road users, vehicle standards, enforcement and emergency care. The board is a snapshot of published estimates and not a judgement on any country.
A worked example
Guinea currently tops the board at around 37 estimated deaths per 100,000 people — more than ten times the rate of the safest countries. Pair it with the Alcohol Consumption Board in Multi-view for a wall of WHO public-health rankings.
Settings & tips
- Rates are estimated deaths per 100,000 population, the WHO's standard road-safety measure.
- Accent recolours the bars and header rule.
- Values and years are real, unedited WHO Global Health Observatory data.
Frequently asked questions
- Is this real data?
- Yes — real estimated road-traffic death rates from the WHO Global Health Observatory's own public API, gathered by the site's pipeline.
- Is a key needed?
- No. The WHO GHO OData API is fully key-less.
- Does it work offline?
- No. It reads a data feed, so it needs an internet connection; offline it shows a short notice instead.
- Is it free?
- Yes — free, no download, in your browser.
- Why are rates estimated rather than counted?
- Many countries under-register road deaths, so the WHO publishes modelled estimates that make countries comparable — that's the honest, standard figure shown here.
- Why use a rate per 100,000 people instead of totals?
- A rate adjusts for population, so a small country and a large one can be compared. Totals would mostly show which countries have the most people.
- How does WHO get a figure for countries with poor records?
- It groups countries by data quality. Those with complete registration use it directly, some are adjusted for gaps, and those without eligible registration data are estimated with a regression model.
- Does a high rate mean the roads are worse?
- Not by itself. Road design is one factor among many, including the mix of road users, vehicle safety, enforcement and emergency care.