Emissions by Sector Screensaver
The Emissions by Sector screensaver shows greenhouse-gas emissions per economic sector from Climate TRACE, which estimates emissions from satellite and sensor observation rather than from what companies report about themselves. It's free, runs in your browser, and ESC exits.
Live preview
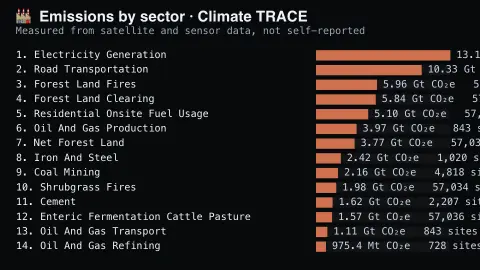
Press ESC to leave fullscreen. Settings are saved in your browser only.
How the Emissions by Sector screensaver works
The saver reads Climate TRACE directly in your browser — no key and no account.
Greenhouse-gas emissions per economic sector from Climate TRACE, which estimates emissions from satellite and sensor observation rather than from what companies report about themselves..
It refreshes on a schedule, so what you see stays current.
Colours can be changed in settings; nothing is stored beyond your own browser.
Counting emissions from orbit instead of from reports
Climate TRACE is a non-profit coalition of more than 100 collaborators, including nonprofits, technology companies, universities and researchers, that publishes emissions estimates for individual facilities and whole sectors around the world. Traditional inventories are compiled from figures that governments and companies report themselves, often with a long delay. Climate TRACE instead combines satellite observation with artificial intelligence and machine learning, drawing on data from satellites and ground-based sensors.
Its member teams provide asset-level estimates for sectors that make up about three quarters of global emissions, while smaller sectors currently have only national-level estimates. Emissions are normally compared as carbon-dioxide equivalent, a convention that converts methane, nitrous oxide and other gases into the CO2 amount with the same warming effect over a chosen period, commonly 20 or 100 years.
These are modelled estimates, so they come with uncertainty, and a figure can be revised when methods or input data improve. Some sources, such as large power plants, are easier to observe than others. The figures offer an independent cross-check on official inventories rather than replacing them.
A worked example
Greenhouse-gas emissions per economic sector from Climate TRACE, which estimates emissions from satellite and sensor observation rather than from what companies report about themselves.
Settings & tips
- Accent and Background recolour the display.
- Data comes straight from Climate TRACE in your browser.
- Press ESC to leave fullscreen.
Frequently asked questions
- Is this real data?
- Yes — it comes from Climate TRACE and is refreshed on a schedule.
- How is this different from reported emissions?
- Climate TRACE estimates emissions from satellite and sensor observation of individual facilities, rather than relying on what operators report about themselves.
- Is a key needed?
- No. This source is fully key-less.
- Is it free?
- Yes — free, no download, in your browser.
- What does CO2-equivalent mean?
- It converts different greenhouse gases into the amount of carbon dioxide that would cause the same warming, so methane, nitrous oxide and CO2 can be added into one total.
- Why can a sector's figure change between updates?
- Climate TRACE refines its models and input data, so earlier estimates can be revised when better satellite or activity information arrives.
- Why does the time horizon matter for methane?
- Methane warms strongly but breaks down faster than CO2, so its CO2-equivalent is larger over 20 years than over 100 years.