Light Pollution Map Screensaver
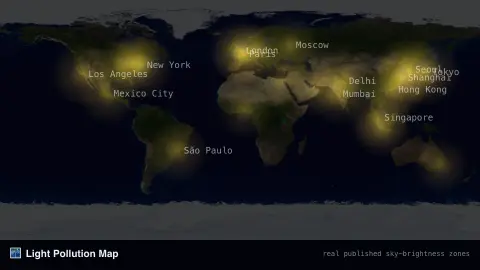
The Light Pollution Map screensaver shades a world map by real, published night-sky brightness zones, from the bright glow of major cities to the last dark places left on Earth. It's free, runs in your browser, and ESC exits.
Live preview
Press ESC to leave fullscreen. Settings are saved in your browser only.
How the Light Pollution Map screensaver works
The map is shaded using real, published night-sky brightness zone data covering the whole world.
Brighter zones mark cities and dense urban regions; the darkest zones mark the world's remaining truly dark skies.
An optional layer labels a few major cities for orientation.
The glow slowly breathes to keep the display alive without implying live data.
How skyglow gets measured
Light pollution is more than glare from street lamps. Much of what astronomers care about is skyglow: artificial light scattered in the atmosphere, which brightens the night sky well beyond the lit area itself. The 2016 World Atlas of artificial night sky brightness, published in Science Advances by Fabio Falchi and colleagues, found that over 80% of the world’s population lives under light-polluted skies, and that the Milky Way is hidden from more than a third of humanity.
Brightness maps of this kind are built from high-resolution satellite measurements of upward-directed light, run through propagation software that models how it scatters, and checked against sky brightness measurements taken on the ground. Sky brightness is often expressed in magnitudes per square arcsecond, where a bigger number means a darker sky; the natural moonless background far from the Milky Way is roughly 22 on that scale.
Look at the map as a long-term picture rather than a live one. It describes typical conditions rather than tonight’s cloud or moonlight, and a satellite view of the ground does not capture everything a person sees. Changes in lighting technology can also shift skyglow: Falchi warned that an uncareful switch to LEDs could raise it two- to three-fold on clear nights.
A worked example
Zoom your attention to Western Europe and the glow is nearly continuous, while regions like the Sahara or central Australia stay a deep, genuine dark — real published sky-brightness patterns.
Settings & tips
- Major cities toggles the reference city labels.
- Accent recolours the brightness gradient.
- Brightness zones are real published reference data, not a live satellite feed.
Frequently asked questions
- Is this live satellite data?
- No — it's a real, published reference dataset of night-sky brightness; artificial light doesn't change fast enough to need a live feed.
- Where are the darkest skies left?
- Real dark-sky regions include parts of the Australian outback, the Sahara, northern Canada and the open oceans.
- Is a key needed?
- No — it's a static, real-geography visualization with no live data fetch.
- Is it free?
- Yes — free, no download, in your browser.
- What is skyglow?
- Skyglow is the diffuse brightening of the night sky caused by artificial light scattering in the atmosphere, which can raise the sky background well beyond the original source.
- How is darkness measured on a scale?
- Sky brightness is often given in magnitudes per square arcsecond, where a higher number means a darker sky. The natural moonless background is roughly 22 on that scale.
- Why can a dark zone still look bright to the eye?
- Cloud, moonlight and nearby lights change what you see on a given night, and the map describes typical conditions rather than a single evening.