Harmonograph / Lissajous Art Screensaver
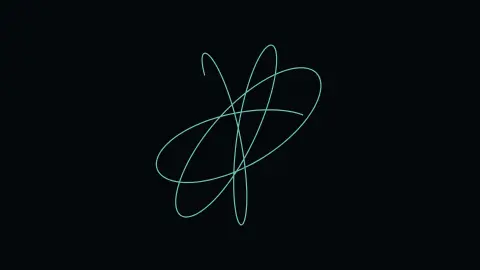
A harmonograph is a real Victorian-era drawing machine where two or more pendulums, each swinging at a slightly different frequency, combine their motion through a linked pen to trace intricate looping curves. This screensaver simulates that exact real physics — two virtual pendulums, gradually losing energy to friction, tracing a decaying spiral of loops.
Live preview
Press ESC to leave fullscreen. Settings are saved in your browser only.
How the Harmonograph / Lissajous Art screensaver works
Two simulated pendulums each swing along their own axis at their own real frequency and phase, exactly like a real physical harmonograph's independent pendulums.
Their combined x and y motion, sampled continuously, traces the drawn curve — the same Lissajous-style combination principle real harmonographs use.
Real friction is simulated too: each pendulum's amplitude decays slowly over time, so the traced curve spirals inward rather than repeating forever.
Small differences between the two pendulums' frequencies are what produce the rich, looping rosette patterns rather than a simple ellipse.
Pendulum mathematics behind harmonograph curves
Harmonographs began to appear in the mid-nineteenth century and were popular as drawing toys and scientific curiosities into the 1890s. Hugh Blackburn, a Glasgow mathematics professor, is commonly credited with early work on the idea. The curves they trace are closely related to those studied by the French physicist Jules Antoine Lissajous in 1857, and by Nathaniel Bowditch decades before him. A simple lateral machine has two pendulums connected to a pen and a drawing board, so the pen's position is the sum of their swings.
Mathematically, each pendulum contributes a sinusoid with its own amplitude, frequency and phase. When two frequencies are in a simple whole-number ratio such as 2:3, the curve closes into a tidy knot; if the ratio is slightly off, the pattern slowly rotates and fills in as a ribbon of loops. Damping multiplies each sinusoid by a shrinking exponential, which is why a harmonograph drawing tightens into a spiral instead of closing.
Musically minded people often notice that the frequency ratios are the same ones behind consonant intervals: 2:1 is an octave and 3:2 a fifth. Simple ratios give clean figures, while less simple ones give busy, shifting tangles. The result depends sensitively on small differences, which is why no two drawings come out identical.
A worked example
Watch the curve begin as wide, sweeping loops and gradually tighten into a dense, intricate rosette near the center as the simulated pendulums lose real energy — then the canvas clears and a fresh curve begins.
Settings & tips
- Line color recolours the traced curve.
- Each fresh curve rolls new random pendulum frequencies, so no two runs look alike.
- Watch closely early on — the initial wide loops reveal the frequency ratio most clearly.
Frequently asked questions
- Is a harmonograph a real machine?
- Yes — real Victorian-era harmonographs used physical swinging pendulums linked to a pen to draw curves exactly like these, and hobbyists still build them today.
- Why do the loops shrink over time?
- Real friction is simulated — each pendulum's swing amplitude decays gradually, exactly as it would on a real physical machine.
- Is a key needed?
- No — it's a pure local computation.
- Is it free?
- Yes — free, no download, in your browser.
- What is the difference between a Lissajous curve and a harmonograph drawing?
- A Lissajous curve has constant amplitude and closes when the two frequencies are in a rational ratio. A harmonograph adds damping, so the same kind of curve shrinks into a spiral.
- Why do simple frequency ratios give cleaner pictures?
- When the ratio is a small whole-number fraction, the motion repeats after a short time and the pen retraces the same path, producing a recognisable knot.
- Do real harmonographs use more than two pendulums?
- Some do. Simple designs use two pendulums, while more complex ones use three or more, or link pendulums together, which gives more intricate drawings. Two are enough to show the core idea.