One Dollar, 145 Ways Screensaver
The One Dollar, 145 Ways screensaver ranks the world's currencies by how many units one US dollar buys, from the full published cross-rate table rather than the usual half-dozen majors. It puts the currencies quoted in tens of thousands next to those quoted in fractions. It runs in the browser with nothing to install; press ESC to exit.
Live preview
Press ESC to leave fullscreen. Settings are saved in your browser only.
How the One Dollar, 145 Ways screensaver works
The saver reads FloatRates' daily published cross-rate feed, key-free.
No account and no key: the request goes straight from your browser, or from this site's own refreshed copy of the feed where the source does not allow browser access.
Values are drawn on a canvas that resizes with the window, so it works on a laptop or a wall display.
If the source is unreachable the saver says so on screen rather than showing stale numbers as though they were current.
A table of exchange rates beyond the majors
FloatRates is a service that publishes exchange-rate tables for well over a hundred currencies, in XML and JSON feeds, and its site cites central-bank sources. Here the base is the US dollar, and each row says how many units of another currency one dollar buys. Those figures are indicative reference rates, not the prices at which a bank would exchange cash.
The spread between entries is the reason the display is interesting. Some currencies are worth more than a dollar per unit, so they are quoted in fractions. Others are quoted in the hundreds, thousands or tens of thousands of units per dollar, because of historical inflation or simply how the unit was originally sized. A big number therefore says nothing about economic strength by itself.
For comparisons over time, look at percentage movements and not at the raw figures. A feed of this kind is updated on a schedule, so it lags live trading, and some minor currencies are thinly traded or pegged, so their rates move rarely.
A worked example
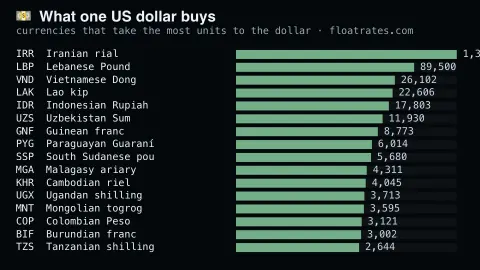
Sixteen currencies with the largest units-per-dollar figures, each with its code, name and rate. Bars are scaled logarithmically, because otherwise the largest entry would flatten every other bar to invisibility. A rate in the tens of thousands usually reflects a currency that has been through sustained inflation and never redenominated, rather than a judgement about the economy today.
Settings & tips
- Accent and Background recolour the display without changing the data.
- Add it to a Multi-view grid to watch it alongside other live savers.
- Press ESC at any time to leave fullscreen.
Frequently asked questions
- Why are the bars logarithmic?
- Because the range spans several orders of magnitude. On a linear scale the largest currency would fill the width and every other bar would be a sliver, which would hide the comparison the chart exists to make.
- How current are these rates?
- The feed publishes daily. It is a reference rate suitable for comparison, not a dealable price — a bank or broker will quote you something different, with a spread.
- Is this real data?
- Yes. It comes from FloatRates' daily published cross-rate feed, key-free. Nothing is invented or simulated, and if the source cannot be reached the saver reports that instead of drawing something plausible.
- Does it cost anything or need an account?
- No. Every screensaver here is free, runs in the browser and needs no sign-up. This one uses a public API that requires no key.
- Does a currency with a huge number per dollar mean a weak economy?
- Not by itself. The denomination of a currency is a historical choice, and some strong economies simply use small units. Redenomination, which removes zeros from a currency, can change the number without changing its value.
- Are these the rates I would get at a bank or bureau?
- No. They are reference rates for comparison. Retail providers add a margin and fees, so real transactions are less favourable than the table.